Learning Horizontal Pod Autoscaler with Wavefront Part-2
· 13 min read
This is the second installment of the Learning Horizontal Pod Autoscaler with Wavefront series.
Series
Part 1 : Overview
Part 2 : Scaling from Wavefront data ← you are here
Part 3 : Implementing a serverless look-alike
Introduction
As written in the overview, this article shows how to implement HPA based on Wavefront metrics.
This time we start simple, implementing CPU-based HPA.
Background knowledge
As background, there are three APIs Kubernetes can use for HPA:
metrics.k8s.io: the so-called Core metrics — as the manual says, reports CPU and Memory utilization. Actual collection happens via metrics-server or Heapster. Note these do not run in Kubernetes by default; they must be started separately.custom.metrics.k8s.io: separate from the above, collects metrics from external data sources and reflects them as metrics. Here lists some available implementations. CNCF-wise, Prometheus is recommended.external.metrics.k8s.io: also metrics from external data sources, but with even more freedom in how they are defined.
Of these, Wavefront supports methods 2 and 3. The list of metrics usable with 2 is defined here:
https://github.com/wavefrontHQ/wavefront-kubernetes-adapter/blob/master/docs/metrics.md
How these map to actual Wavefront metrics is touched on later. With method 3, you can also map any metric you like using Annotations:
https://github.com/wavefrontHQ/wavefront-kubernetes-adapter/blob/master/docs/metrics.md
Preparation
Before starting the verification you need:
- A Wavefront account and API key
- A Kubernetes environment
- The Helm (v3 recommended) cli
If you don't have a Wavefront account, I recommend signing up for a Trial. If even that's too much hassle, there is — with very many restrictions — a signup-free Freemium account:
Currently a Wavefront Freemium account can only be created via Spring Boot. At minimum, build the HelloWorld app introduced here. Once created, ~/.wavefront_freemium contains the API key.
Installation
First, install the Wavefront components. We install these two:
- Wavefront Collector
- Wavefront HPA Adaptor
Both use it, so prepare the following myvalues.yaml.
Put your Wavefront account and API key in the XXXX parts, and give ClusterName any easily recognizable name.
clusterName: mhoshi-test

wavefront:
  url: https://XXXXX.wavefront.com
  token: XXXXXXXXXXXXXXX
Also download the Helm Repository:
helm repo add wavefront https://wavefronthq.github.io/helm/
helm repo update
Installing the Wavefront Collector
Install with:
kubectl create namespace wavefront
helm install -f myvalues.yaml wavefront wavefront/wavefront --namespace wavefront
Installing the Wavefront HPA Adapter
Install with:
kubectl create namespace wavefront-adapter
helm install -f myvalues.yaml wavefront-adapter wavefront/wavefront-hpa-adapter --namespace wavefront-adapter
Installation complete.
Scaling on CPU data
Let's try HPA right away. First create a working namespace:
kubectl create ns hpa
Create any Kubernetes Deployment. In my case, the quick way:
kubectl create deployment --image=nginx hpa-pods -n hpa
Next, create the HPA definition:
cat <<EOF | kubectl apply -n hpa -f -
apiVersion: autoscaling/v2beta1
kind: HorizontalPodAutoscaler
metadata:
  name: example-hpa-custom-metrics
spec:
  minReplicas: 1
  maxReplicas: 5
  metrics:
  - type: Pods
    pods:
      metricName: cpu.usage_rate
      targetAverageValue: 300m
  scaleTargetRef:
    apiVersion: apps/v1
    kind: Deployment
    name: hpa-pods
EOF
This defines an HPA of minimum 1 and maximum 5 Pods.
And as targetAverageValue: 300m says, we expect it to settle at a CPU usage of 300 millicores.
Confirm the HPA exists. Right after creation TARGETS may show unknown — that's when metrics haven't reached Wavefront yet; wait a bit and the value gets picked up.
kubectl get hpa -n hpa
NAME                         REFERENCE             TARGETS          MINPODS   MAXPODS   REPLICAS   AGE
example-hpa-custom-metrics   Deployment/hpa-pods   <unknown>/300m   1         5         0          8s
After a while, TARGETS gets a value:
kubectl get hpa -n hpa
NAME                         REFERENCE             TARGETS   MINPODS   MAXPODS   REPLICAS   AGE
example-hpa-custom-metrics   Deployment/hpa-pods   0/300m    1         5         1          6m20s
Now let's drive the CPU load up. The quick way is entering the Container and creating an infinite loop:
kubectl exec -it `kubectl get pods -l app=hpa-pods -n hpa -o name` -n hpa bash
After logging into the Container, run the following command. It creates one do-nothing infinite loop, theoretically pushing one vCPU to 100% utilization:
while true ; do : ; done &
Open the Wavefront UI. Open the Metrics Viewer and enter this expression, using the ClusterName you specified:
ts("kubernetes.pod.cpu.usage_rate", pod_name="hpa-*" and namespace_name="hpa")
This computes the CPU usage of all pods named hpa-* in namespace hpa.
You can see the CPU usage rising:
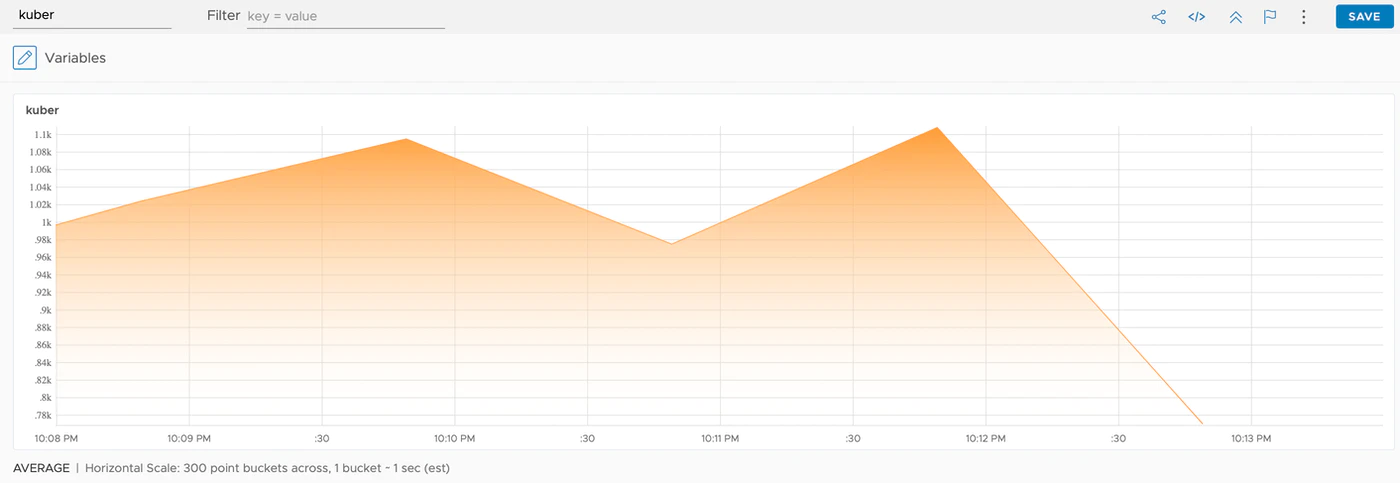
The current configuration starts scaling when CPU usage exceeds 300m. Left alone for a while, the pod count moves to 5:
% kubectl get hpa -n hpa
NAME                         REFERENCE             TARGETS        MINPODS   MAXPODS   REPLICAS   AGE
example-hpa-custom-metrics   Deployment/hpa-pods   219200m/300m   1         5         5          19m
% kubectl get po -n hpa
NAME                       READY   STATUS    RESTARTS   AGE
hpa-pods-8d86f4dc5-2xn52   1/1     Running   0          8m46s
hpa-pods-8d86f4dc5-7wnpw   1/1     Running   0          8m46s
hpa-pods-8d86f4dc5-qbdn9   1/1     Running   0          7m12s
hpa-pods-8d86f4dc5-r55hb   1/1     Running   0          8m46s
hpa-pods-8d86f4dc5-wgc8g   1/1     Running   0          20m
To stop the Pod that's spinning the CPU, run:
kubectl delete po hpa-pods-8d86f4dc5-wgc8g -n hpa
After a while, the Pods settle back down to 1:
kubectl get hpa -n hpa
NAME                         REFERENCE             TARGETS   MINPODS   MAXPODS   REPLICAS   AGE
example-hpa-custom-metrics   Deployment/hpa-pods   0/300m    1         5         1          35m
How are the metrics computed?
The quickest way to answer this is reading the code. The part responsible for querying Wavefront is here:
As the commented lines in the code note, the HPA definition is translated as follows:
	// if Prefix=kubernetes, metric='cpu.usage_rate', resType='pod', namespace='default' and names=['pod1', 'pod2']
	// ts(kubernetes.pod.cpu.usage_rate, (pod_name="pod1" or pod_name="pod2") and (namespace_name="default"))
	query := fmt.Sprintf("ts(%s.%s.%s%s)", t.prefix, resType, metric, filters)
So if you define the HPA like this:
spec:
  ...
  metrics:
  - type: Pods
    pods:
      metricName: cpu.usage_rate
      targetAverageValue: 300m
Wavefront is asked for the <prefix>.<type>.<metricName> metric.
In this case:
<prefix>defaults tokubernetesvia a startup option<type>is converted from the HPA definition'stype: Podstopod<metricName>comes from the HPA definition'smetricName: cpu.usage_rate
So it looks up kubernetes.pod.cpu.usage_rate, filtered down by pod names and Namespace.
The more standard implementation approach is described in detail here.
Summary
- Wavefront enables HPA via
custom.metrics.k8s.ioandexternal.metrics.k8s.io - The list usable with
custom.metrics.k8s.iois at https://github.com/wavefrontHQ/wavefront-kubernetes-adapter/blob/master/docs/metrics.md - With
custom.metrics.k8s.io, the defined HPA info is interpreted, converted into a Wavefront metric, and queried
This installment implemented HPA based on the CPU data arriving in Wavefront's statistics. Next, in "Implementing a serverless look-alike", we implement HPA based on a more outlandish metric.