Learning Distributed Tracing with Wavefront Part-1
· 5 min read
This is the first installment of the Learning Distributed Tracing with Wavefront series.
Series
Part 1 : Overview ← you are here
Part 2 : Distributed tracing with Spring Boot
Part 3 : What are RED metrics?
Part 4 : Connecting services together
Part 5 : Distributed tracing with Python
Part 6 : Distributed tracing with AMQP
Part 7 : Distributed tracing with a service mesh
What on earth is Wavefront?
Wavefront is a SaaS-based cloud and application monitoring platform.
It has since been acquired by VMware and is called Tanzu Observability.
This series frequently uses the old name Wavefront, but they are the same thing.
What on earth is distributed tracing?
For distributed tracing, our colleague Clement's video explains it well, so here it is:
[
https://www.youtube.com/watch?v=Z7mf_oZfcSE
Yes, it's in English. So, to summarize the key points...
- The concept is explained using Lyft (something like Uber) as an example
- Distributed tracing has two main elements: the Trace and the Span
- A Trace is one complete unit of work; the video explains it as the process from requesting a Lyft ride to getting out of the car
- A Span is each individual unit of processing that makes up a Trace
- Distributed tracing means making these easy to grasp visually — seeing where the problems are and which steps are taking time
Wavefront is a tool that uses this distributed tracing to visualize applications.
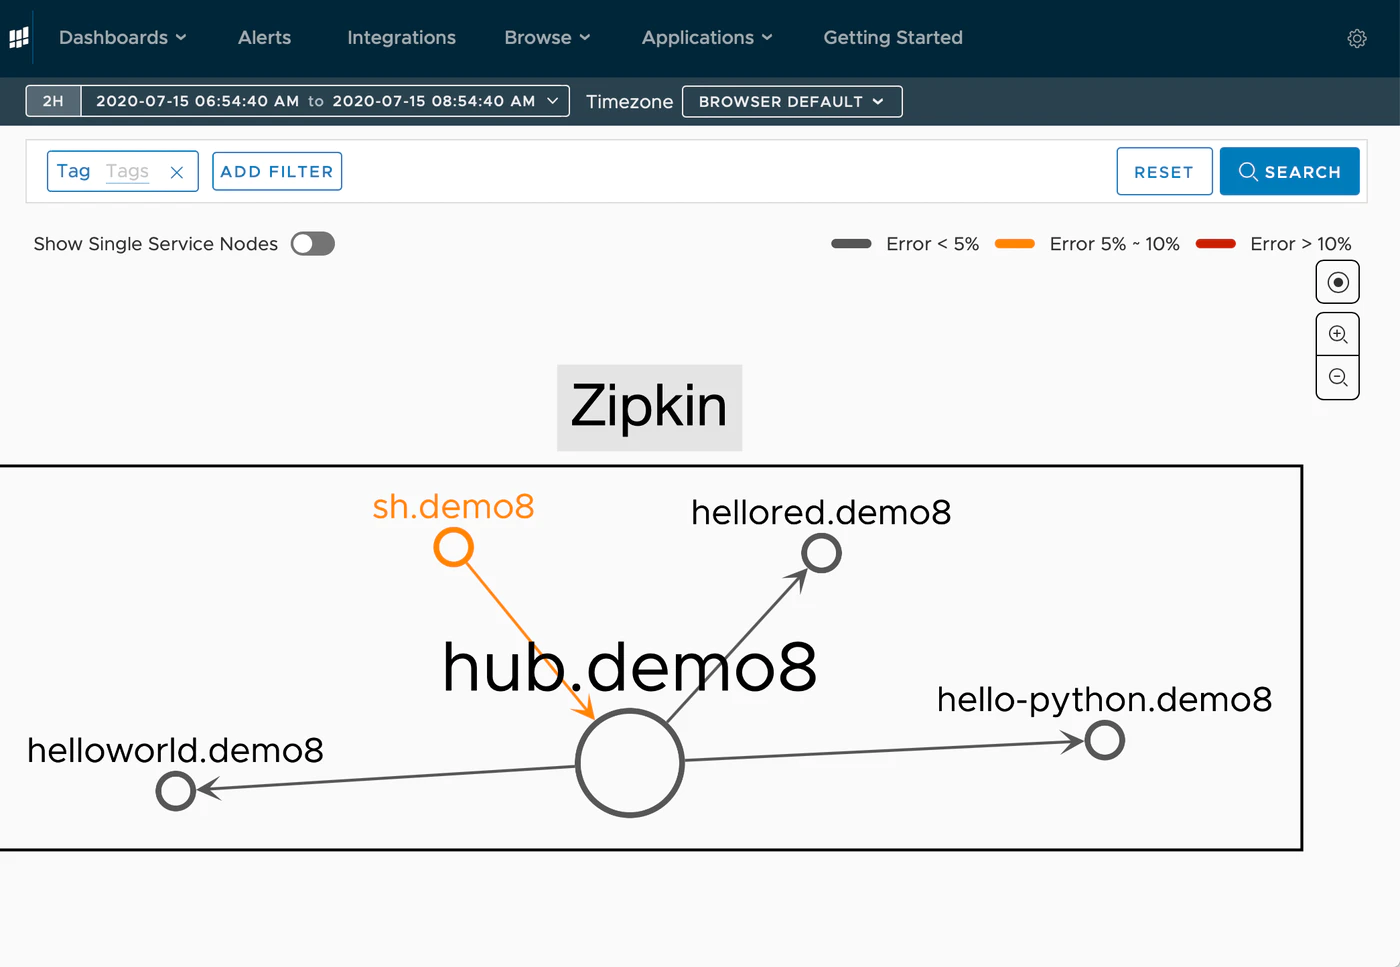
For example, it can express how the containers in a microservice are connected in a graph like this:
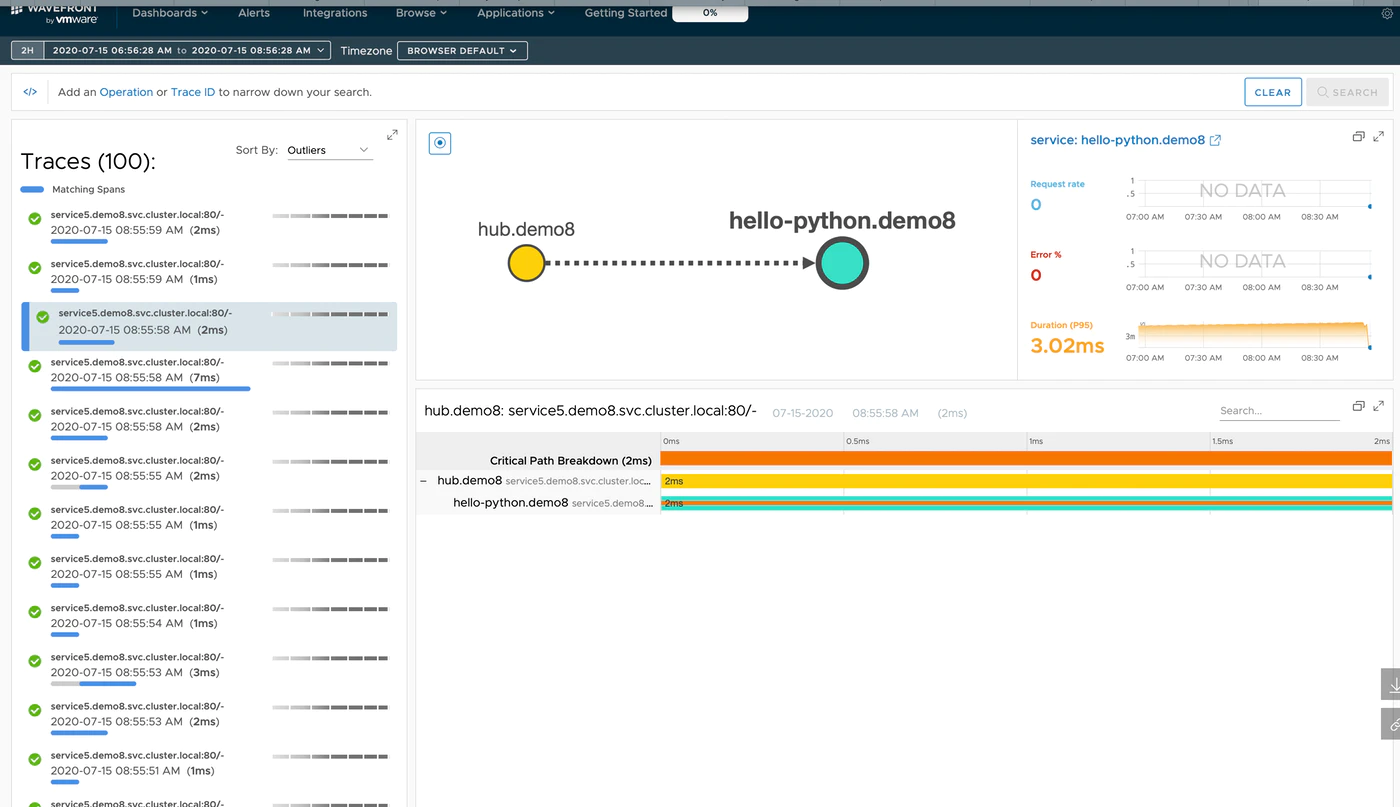
And it shows which steps took how long, which are failing, and so on:
So what is this series?
Now, a little about the series itself. I first touched distributed tracing three years ago, while studying the service mesh Istio. Istio was often introduced together with Zipkin (or Jaeger). But honestly, I didn't understand it well. And I couldn't bring myself to set up the environment either.
This series is for people at (probably) my level, focusing on the following as it covers distributed tracing:
- Spend as little money and time as possible
- Explain from the Hello World level for people who can't write applications at all
- Understand why Istio and distributed tracing are related
- Get to know Wavefront/Tanzu Observability
And so, next up: "Distributed tracing with Spring Boot".