Learning Distributed Tracing with Wavefront Part-7
· 15 min read
This is the seventh installment of the Learning Distributed Tracing with Wavefront series.
Series
Part 1 : Overview
Part 2 : Distributed tracing with Spring Boot
Part 3 : What are RED metrics?
Part 4 : Connecting services together
Part 5 : Distributed tracing with Python
Part 6 : Distributed tracing with AMQP
Part 7 : Distributed tracing with a service mesh ← you are here
Introduction
After seven installments, we finally wrap up the service mesh and distributed tracing story mentioned in the overview.
What is distributed tracing?
Summarizing what this series has covered:
- Distributed tracing is a means of monitoring applications (Part 1)
- In distributed tracing there is a Trace ID representing a complete unit of work and a Span ID representing an individual step (Part 2)
- Once you can monitor distributed traces, you can see RED metrics (Part 3) and the connections between services (Part 4)
- Distributed tracing exchanges Trace IDs and Span IDs by adding them to the communication headers (Part 4 and Part 6)
- Reading the information in those headers, updating Span IDs, and propagating them to downstream applications is the application's responsibility (i.e., it must be coded) (Part 5)
Of all these, the last point is the most important: distributed tracing has become the developer's job. If it isn't coded correctly, no distributed tracing logs get collected. And if it's coded incorrectly, the results differ from expectations.
It's "monitoring", yet we have to rely on developers
Distributed tracing is, broadly speaking, "monitoring" — traditionally an infrastructure-operations task — yet it depends on developers, making it a monitoring item with a very high barrier.
In my own experience, I have never seen an infrastructure team monitoring distributed traces in production. At many sites it probably never even makes the agenda.
However, with the recent movement toward microservices, monitoring between services will keep growing in importance. As a result, infrastructure teams may increasingly need to be able to monitor distributed traces too.
Enter the service mesh, dashing to the rescue
That's where the service mesh comes in. From a distributed tracing perspective, a service mesh has the advantage of visualizing traces even when the application has no distributed tracing code.
Explained in cartoons...
Suppose we have apps like this:
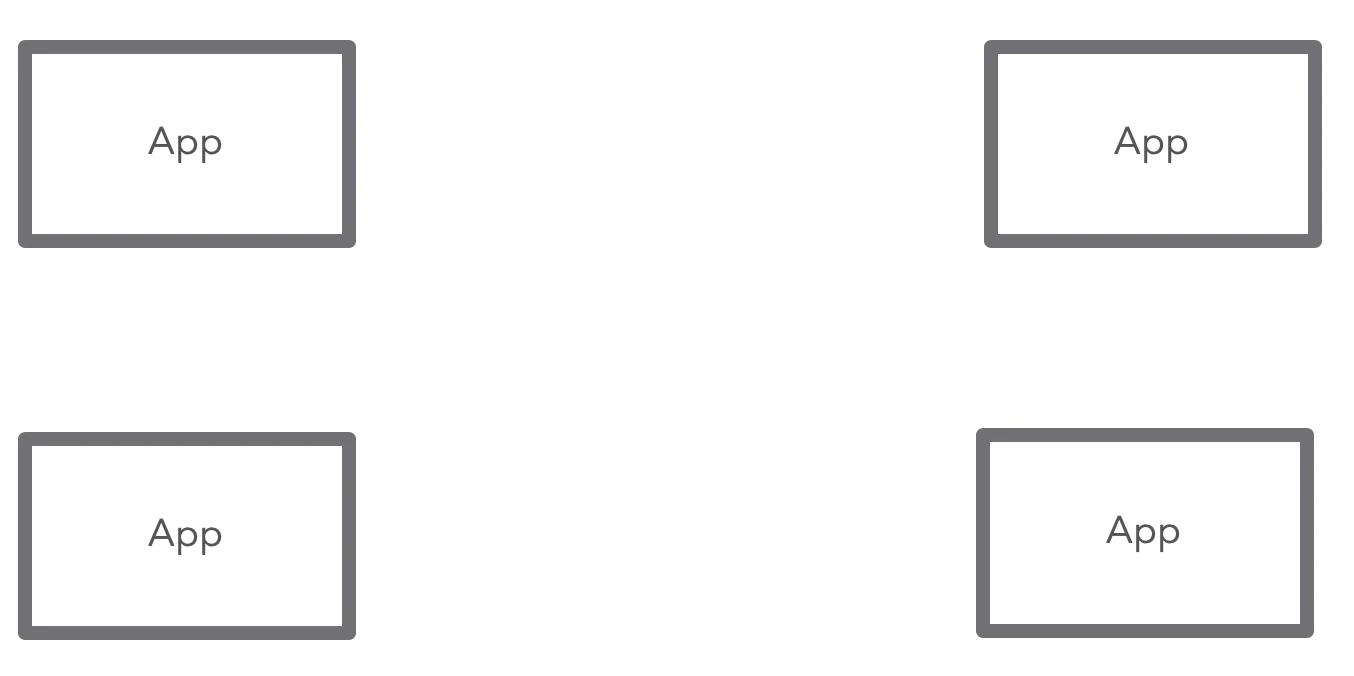
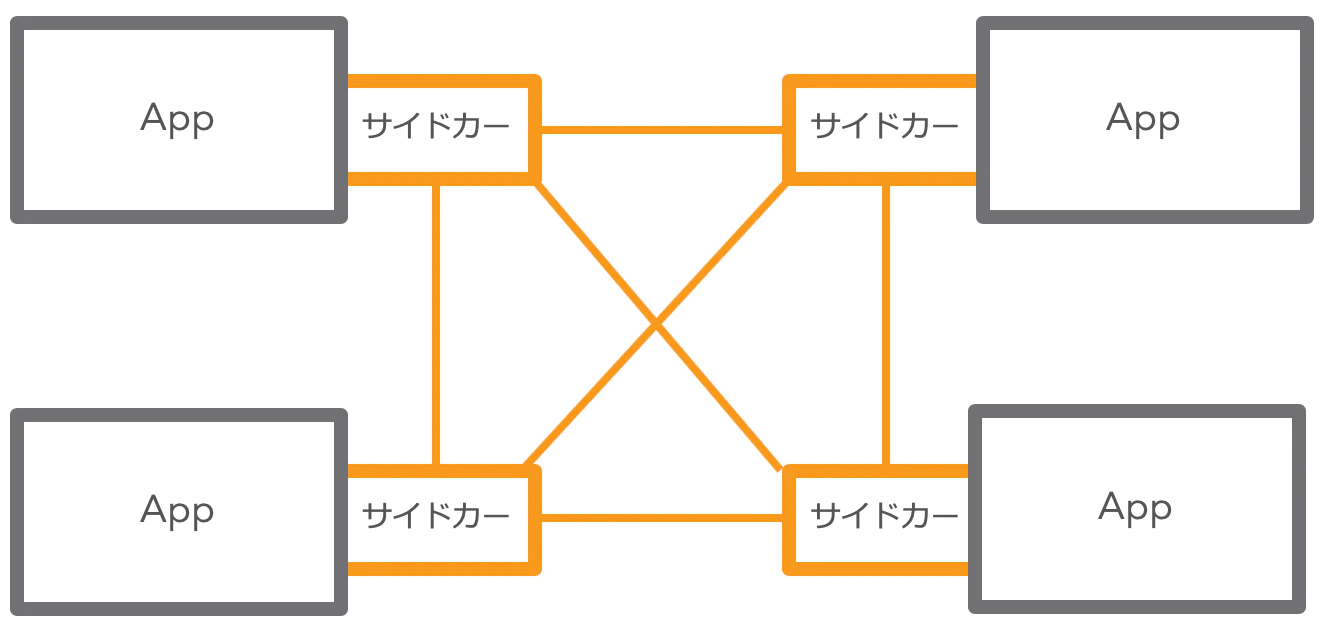
A service mesh is a technology that runs something called a sidecar between these services:
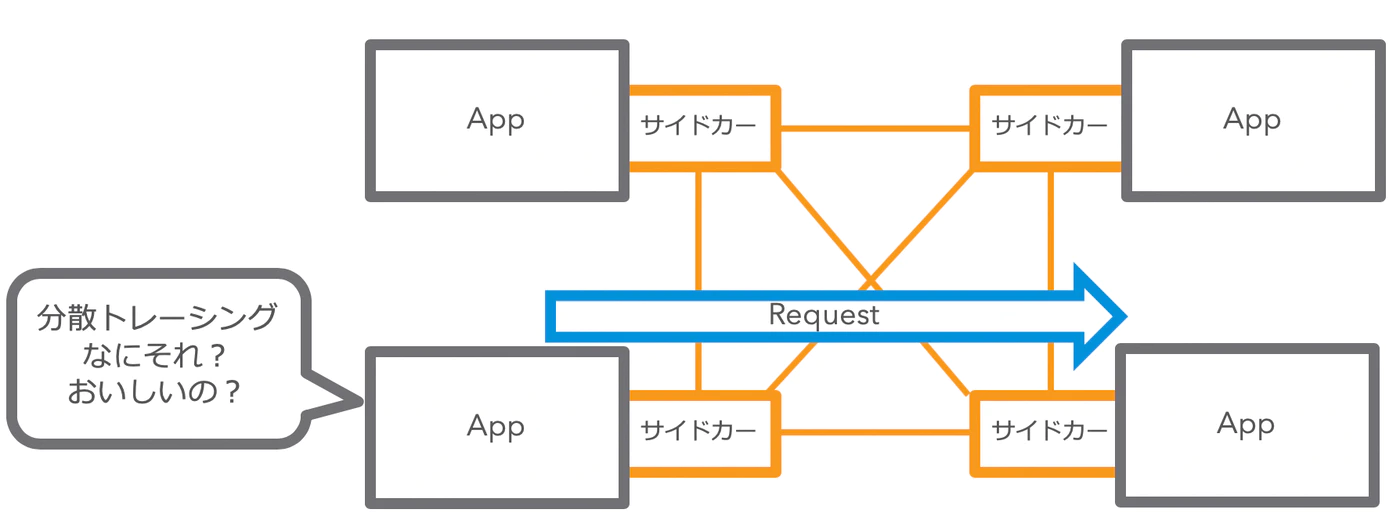
Suppose there's an app that responds "distributed tracing? what's that, is it tasty?" — that is, one with zero distributed tracing support:
The sidecar looks at the HTTP headers, and if there's no distributed tracing, it inserts tracing information on its own:
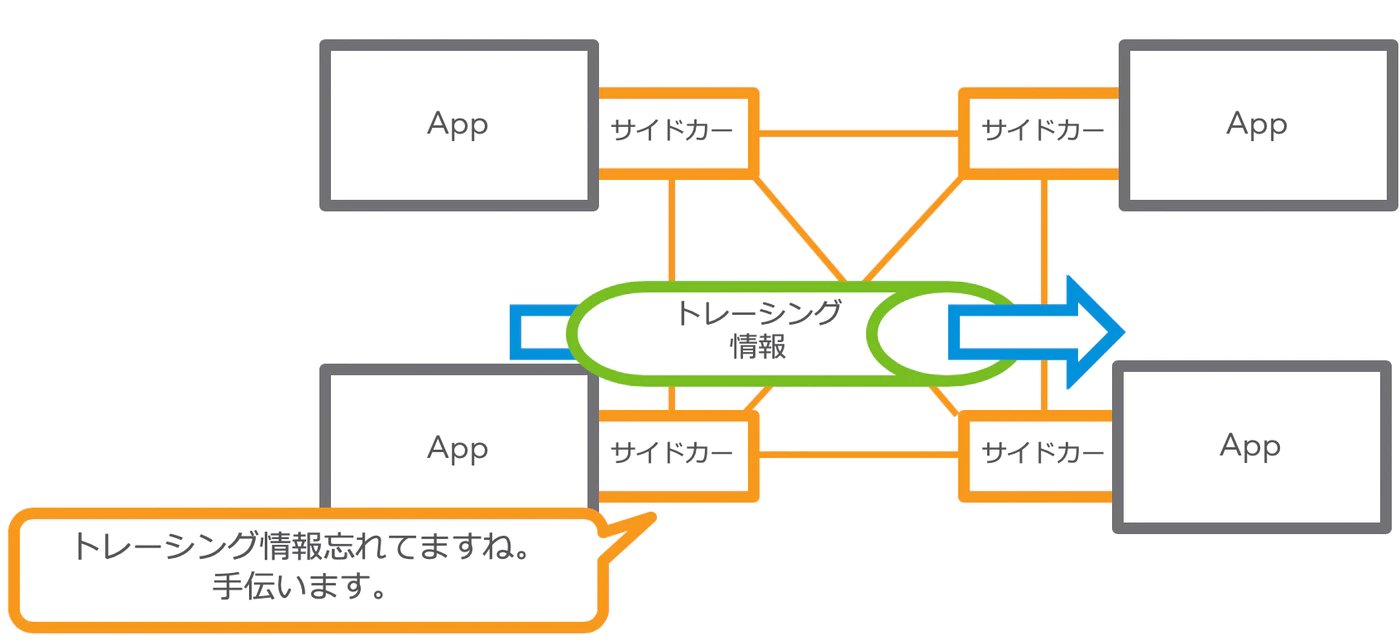
So without relying on developers, just standing up service mesh infrastructure enables distributed tracing. This is why service meshes and distributed tracing are so often mentioned together.
Let's observe this behavior through actual verification.
Preparation
For this exercise you need:
- A Kubernetes + Istio environment
- A Wavefront account and API key
This article assumes all of these are already in place. That's because Istio is quite heavy, and trying it on Minikube and the like often ends up being nothing but pain. Also, on the Wavefront side, the Freemium account we've been using cannot capture Istio's distributed traces by default. So what follows requires at least a Trial account (sign-up required) or a production account.
Set up the Istio–Wavefront integration following:
https://github.com/wavefrontHQ/wavefront-kubernetes/tree/master/istio
Preparation
The code for this time is available at:
https://github.com/mhoshi-vm/wf-demanabu-dis-tracing/
With a connection to Kubernetes, run:
git clone https://github.com/mhoshi-vm/wf-demanabu-dis-tracing/
cd wf-demanabu-dis-tracing/7/kube-resources
kubectl apply -f ./
After a while, Pods come up like this:
kubectl get po -n demo7
NAME                            READY   STATUS    RESTARTS   AGE
bash-7bf77657d9-d944j           2/2     Running   0          14m
hello-python-6764dc77c8-z2ftr   2/2     Running   0          14m
hellored-6b6f86c4c6-nf4qx       2/2     Running   0          14m
helloworld-84c4c97c88-4g5zb     2/2     Running   0          14m
hub-54cd8f855f-mxvvc            2/2     Running   0          14m
Log into the bash-* Pod:
kubectl exec -it <bash-XXXX> -n demo7 sh
Once the prompt is up, run:
apk add curl
curl service3/hub
Run the final curl several times.
Explanation
Now go look at Wavefront.
You should see a screen like this:
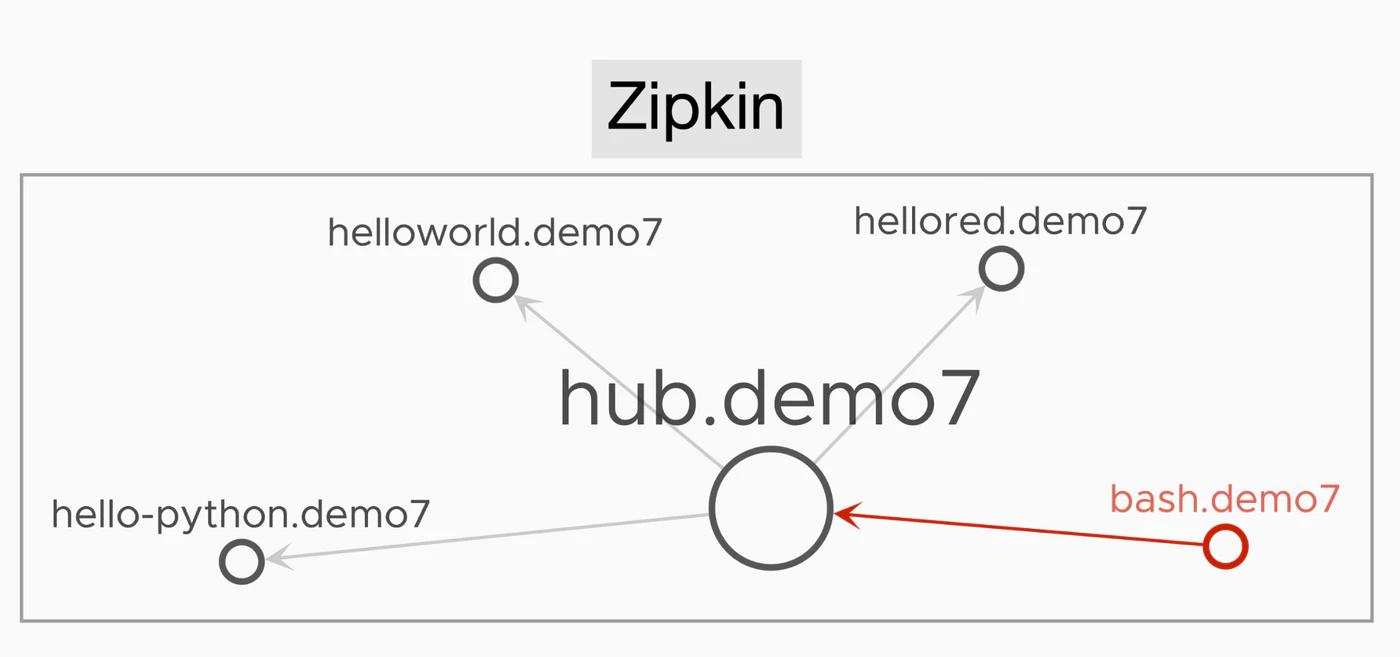
The components in the diagram are:
- helloworld.demo7 > the app from Part 2 with Sleuth disabled
- hellored.demo7 > the app from Part 3 with Sleuth disabled
- hub.demo7 > the app from Part 4 with Sleuth disabled; it also fires requests to helloworld, hellored and hello-python
- hello-python.demo7 > the app from Part 5 with Tracing disabled
- bash.demo7 > a plain alpine image, from which curl is run
For reference, disabling Sleuth is done by setting spring.sleuth.enabled: "false" in the configmap, like this. (*Sleuth, as touched on in past installments, is the library that does distributed tracing transparently to the code.)
The key point: even though Sleuth/Tracing was disabled in every app, in an Istio-enabled environment all the Trace information still shows up.
Interestingly, even bash.demo7, which just runs a curl command, participates in distributed tracing.
So, as described earlier, we confirmed the service mesh benefit: distributed tracing without adding any code on the application side.
Wait — is it really coding-free though?
However, the Istio manual says:
https://istio.io/latest/faq/distributed-tracing/#how-to-support-tracing
for a complete view of the traffic flow, applications must propagate the trace context between incoming and outgoing requests.
Contrary to my explanation above, it says applications must unpack and insert headers. The key is "for a complete view".
Let me explain with the earlier app.
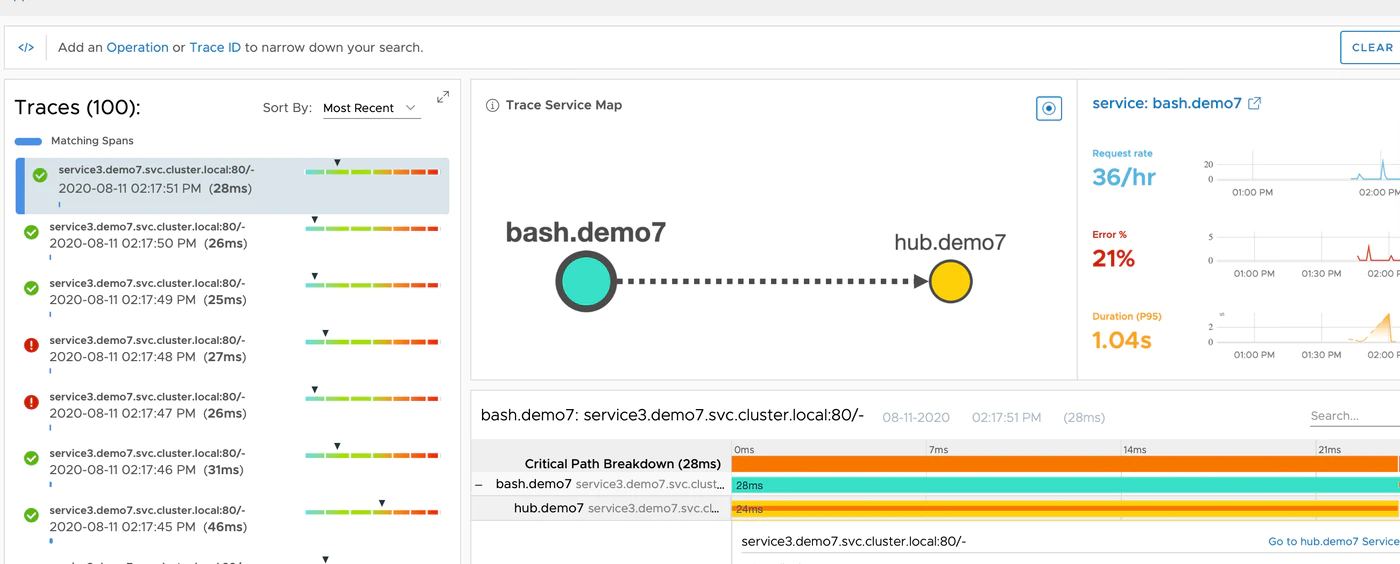
When we ran curl service3/hub from the bash-* pod, the hub service fired requests at the remaining services. So from the bash-* pod's perspective, all requests should carry the same Trace ID.
To check, look at the Trace View on the Wavefront side. In the Trace Service Map view in the image below, contrary to expectations, the Trace breaks off at bash > hub:
Furthermore, hub > helloworld also shows up as a separate Trace:
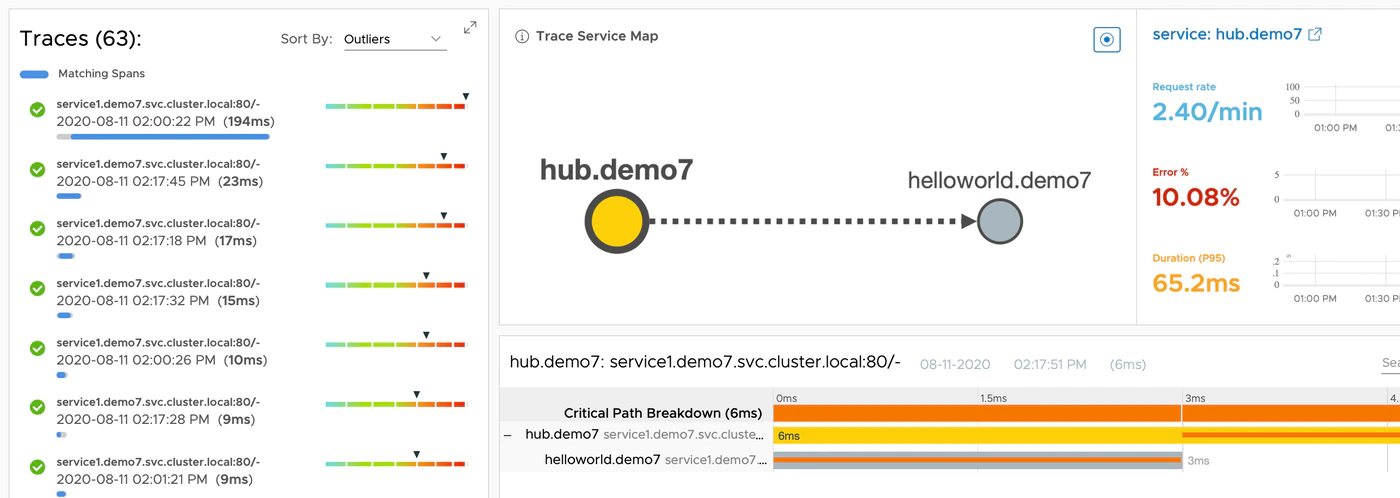 This behavior is the limitation when no distributed tracing code is embedded on the application side.
In other words, what Istio and other service meshes can assist with is only point-to-point communication. Chains spanning multiple services cannot be mapped correctly.
This behavior is the limitation when no distributed tracing code is embedded on the application side.
In other words, what Istio and other service meshes can assist with is only point-to-point communication. Chains spanning multiple services cannot be mapped correctly.
Let's verify this final explanation.
Enabling application-side distributed tracing
I prepared the exact same kubernetes resources with spring.sleuth.enabled: "true", enabling Spring Boot's distributed tracing:
mhoshino@mhoshino 7 % diff kube-resources kube-update
diff kube-resources/05-configmap.yaml kube-update/05-configmap.yaml
7c7
<   spring.sleuth.enabled: "false"
---
>   spring.sleuth.enabled: "true"
15c15
<   spring.sleuth.enabled: "false"
---
>   spring.sleuth.enabled: "true"
23c23
<   spring.sleuth.enabled: "false"
---
>   spring.sleuth.enabled: "true"
mhoshino@mhoshino 7 %
Redeploy using these:
git clone https://github.com/mhoshi-vm/wf-demanabu-dis-tracing/
cd wf-demanabu-dis-tracing/7/kube-update
kubectl delete -f ./
kubectl apply -f ./
Once up, log into the bash-* Pod as before:
kubectl exec -it <bash-XXXX> -n demo7 sh
At the prompt, run the same commands as before:
apk add curl
curl service3/hub
Now look at the Wavefront Trace view once more. This time, unlike before, the Trace Service Map view shows all applications connected, as expected:
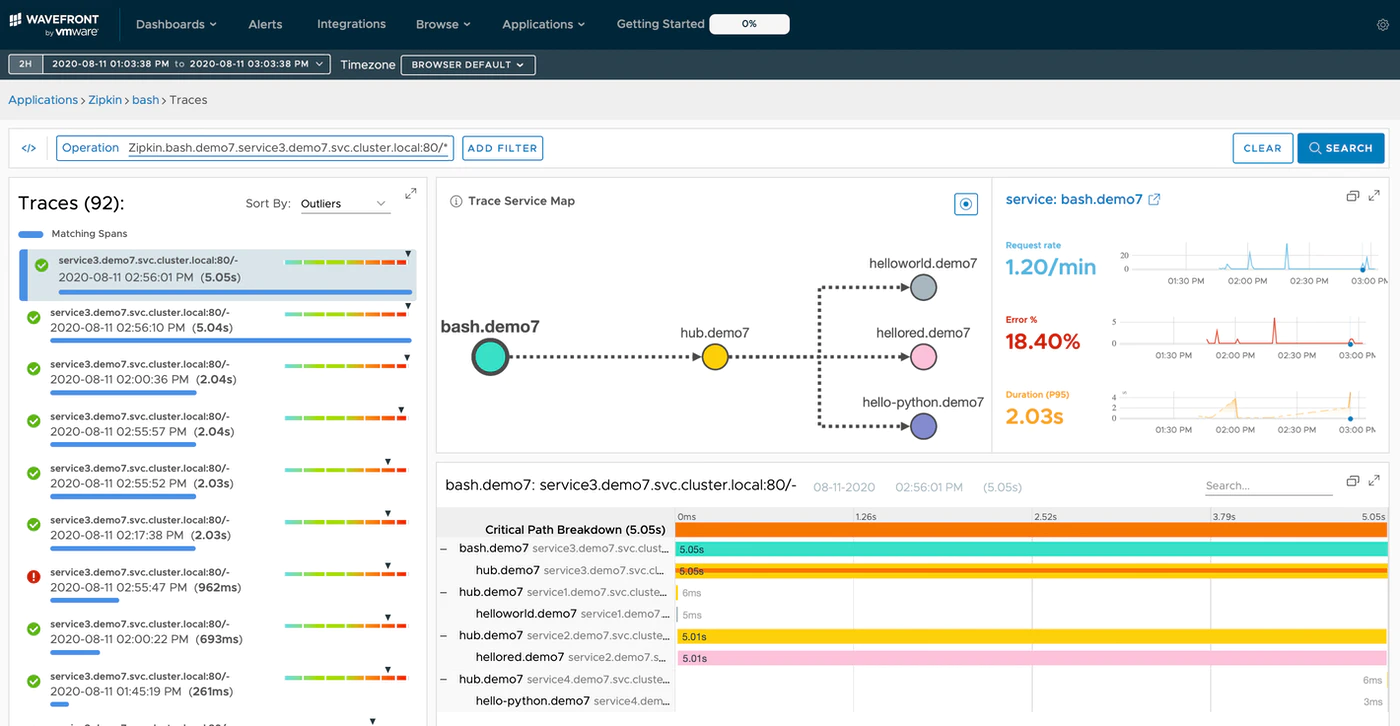
So this verification shows that to represent the truly correct picture, header handling on the application side is necessary — service mesh or not.
Summary
Wrapping up this installment:
- A service mesh takes some code that used to be the application developer's responsibility and makes it manageable from the infrastructure side
- With a service mesh, even apps with zero distributed tracing support can have trace information displayed
- What the service mesh helps with is strictly point-to-point service visibility
- For visibility across chains of multiple services, application coding is unavoidable
And with that, all seven installments of this series are written. Personally, I hope you also take away the following:
- Distributed tracing is still evolving, and infrastructure folks will need to learn it going forward
- Wavefront, despite being a SaaS service, lets you start verifying distributed tracing immediately — and for free
- I'd love for more people to know about Wavefront