Learning Distributed Tracing with Wavefront Part-5
· 18 min read
This is the fifth installment of the Learning Distributed Tracing with Wavefront series.
Series
Part 1 : Overview
Part 2 : Distributed tracing with Spring Boot
Part 3 : What are RED metrics?
Part 4 : Connecting services together
Part 5 : Distributed tracing with Python ← you are here
Part 6 : Distributed tracing with AMQP
Part 7 : Distributed tracing with a service mesh
Introduction
In past installments we covered distributed tracing with Spring Boot. To recap:
- The crux of distributed tracing is the Trace ID and Span ID
- Services get connected by sharing Trace IDs and Span IDs between them via HTTP headers
- In Spring Boot, Sleuth handles Trace IDs and Span IDs almost transparently to your code
With Spring Boot, distributed tracing happens with hardly any attention in your code. That's convenient, but this time we deliberately take the harder road to deepen understanding.
This time we do it in Python. Wavefront provides a dedicated SDK for distributed tracing from Python code — the OpenTracing SDK:
https://github.com/wavefrontHQ/wavefront-opentracing-sdk-python
Preparation
What you need this time:
- Python 3
See here for installation. As usual, no fancy editor is required.
Once Python is installed, create a virtualenv since we want to test the dependencies locally only. Run the following in any directory:
virtualenv env1
source env1/bin/activate
Source code
Published here:
https://github.com/mhoshi-vm/wf-demanabu-dis-tracing/tree/master/5
Preparing the code
hello.py
As a first step, prepare some simple code.
We use Flask for the REST API. Save the following as requirements.txt:
flask
flask-jsonpify
flask-sqlalchemy
flask-restful
Then install the dependencies:
pip install -r requirements.txt
Make the code as follows, saved as hello.py:
from flask import Flask

app = Flask(__name__)

@app.route("/")
def hello():
    return "Hello World!"


if __name__ == '__main__':
    app.run(debug=True,host='0.0.0.0')
Start it:
python hello.py
Confirm you can reach it with curl:
curk localhost:5000
If Hello World! comes back at this point, you've succeeded.
For now it's nothing interesting beyond that. Naturally, nothing shows up on the Wavefront side.
Now we add the distributed tracing machinery.
Updating the code
For the distributed tracing code, first fix the dependencies.
Update requirements.txt to:
flask
flask-jsonpify
flask-sqlalchemy
flask-restful
wavefront-sdk-python
wavefront-opentracing-sdk-python
Then install the dependencies:
pip install -r requirements.txt
And replace the code with the following:
from flask import Flask,request

# Set up sender
import opentracing

from wavefront_opentracing_sdk import WavefrontTracer
from wavefront_opentracing_sdk import span_context
from wavefront_opentracing_sdk.reporting import CompositeReporter
from wavefront_opentracing_sdk.reporting import ConsoleReporter
from wavefront_opentracing_sdk.reporting import WavefrontSpanReporter

import wavefront_sdk
import argparse


app = Flask(__name__)

@app.route("/")
def hello():
    span_ctx=None
    with tracer.start_active_span('hello', child_of=span_ctx, ignore_active_span=True, finish_on_close=True):
      return "Hello World!"


if __name__ == '__main__':
    parser = argparse.ArgumentParser()
    parser.add_argument('token')
    args = parser.parse_args()
    application_tag = wavefront_sdk.common.ApplicationTags(
        application='demo5',
        service='hello-python')
    # Create Wavefront Span Reporter using Wavefront Direct Client.
    direct_client = wavefront_sdk.WavefrontDirectClient(
        server="https://wavefront.surf",
        token=args.token,
        max_queue_size=50000,
        batch_size=10000,
        flush_interval_seconds=5)
    direct_reporter = WavefrontSpanReporter(direct_client)


    # Create Composite reporter.
    # Use ConsoleReporter to output span data to console.
    composite_reporter = CompositeReporter(
        direct_reporter, ConsoleReporter())

    # Create Tracer with Composite Reporter.
    tracer = WavefrontTracer(reporter=composite_reporter,
                             application_tags=application_tag)


    app.run(debug=True,host='0.0.0.0')
A few lines of code suddenly feel complex, but let's start it anyway.
The argument requires your Wavefront ID; if you did the Spring Boot parts earlier, the ID should be in a file called ~/.wavefront_freemium. So start it like this:
python hello.py `cat ~/.wavefront_freemium`
If ~/.wavefront_freemium doesn't exist, run through the verification in Part 2.
Confirm you can reach it with curl:
curk localhost:5000
If Hello World! comes back at this point, you've succeeded.
Run it a few times, then access:
Select [Applications] > [Applications Map(Beta)] and turn on Show Single Service Nodes.
You should see demo5, hello-python.
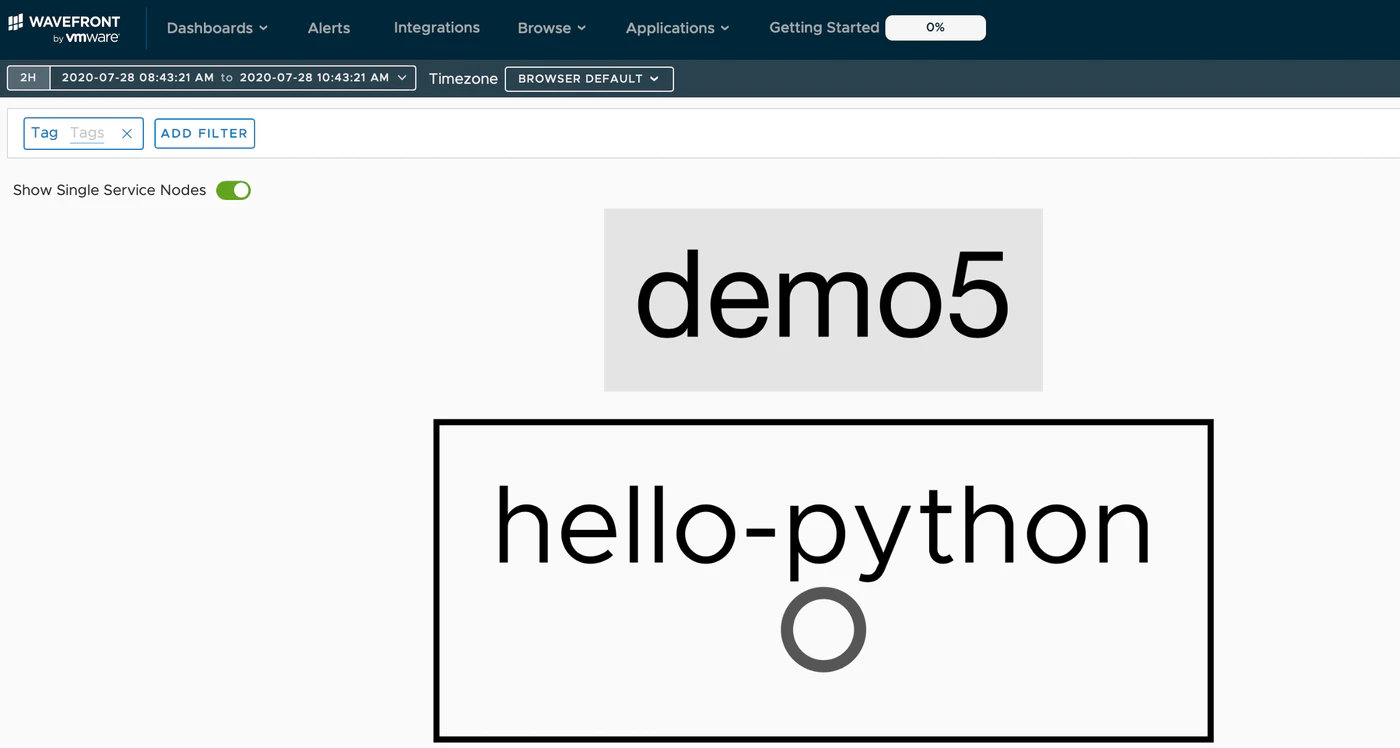
Focusing on it, Wavefront even recognizes it's Python:
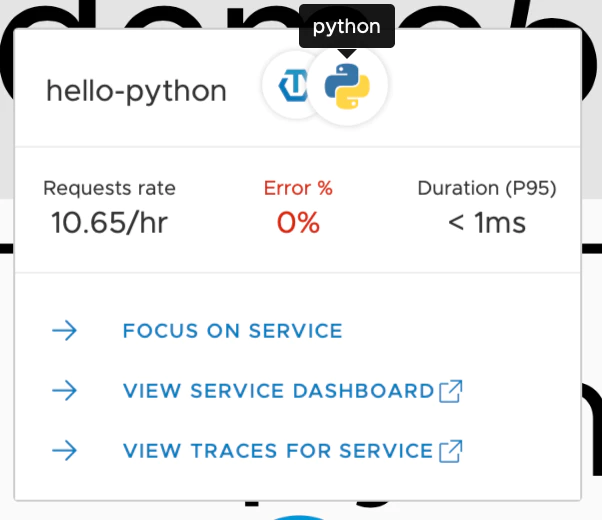
Also try "View Service Dashboard" and "View Traces for Service". You should see screens like last time. (No detail this time.)
Code analysis
There are only two points worth noting in this code. The first is where the Tracer object is created:
    # Create Tracer with Composite Reporter.
    tracer = WavefrontTracer(reporter=composite_reporter,
                             application_tags=application_tag)
This code and what precedes it define how to connect to Wavefront. Once the Tracer is created, Python's with syntax defines which part to trace.
That's this part of the code:
@app.route("/")
def hello():
...
    with tracer.start_active_span('hello', child_of=span_ctx, ignore_active_span=True, finish_on_close=True):
      return "Hello World!"
Coding what you want traced at arbitrary points like this is the library-based way of doing distributed tracing. The flipside: if you don't put such code in exactly the right places, you may end up sending unintended trace information.
Connecting the services
Now let's connect the HUB app from last time to the new Python app. Prepare it following the previous HUB app preparation.
Finally, start it with the command below. This overrides the hub.urls value so it calls the python code:
./mvnw spring-boot:run -Dspring-boot.run.arguments=--hub.urls=http://localhost:5000
And hit this URL:
curl localhost:8083/hub
If it works, you should see:
REST Complete
Everything looks like a success — but let's log into the Wavefront URL.
They're not connected!
Even after waiting a while, you'll likely see this — the two services don't connect:
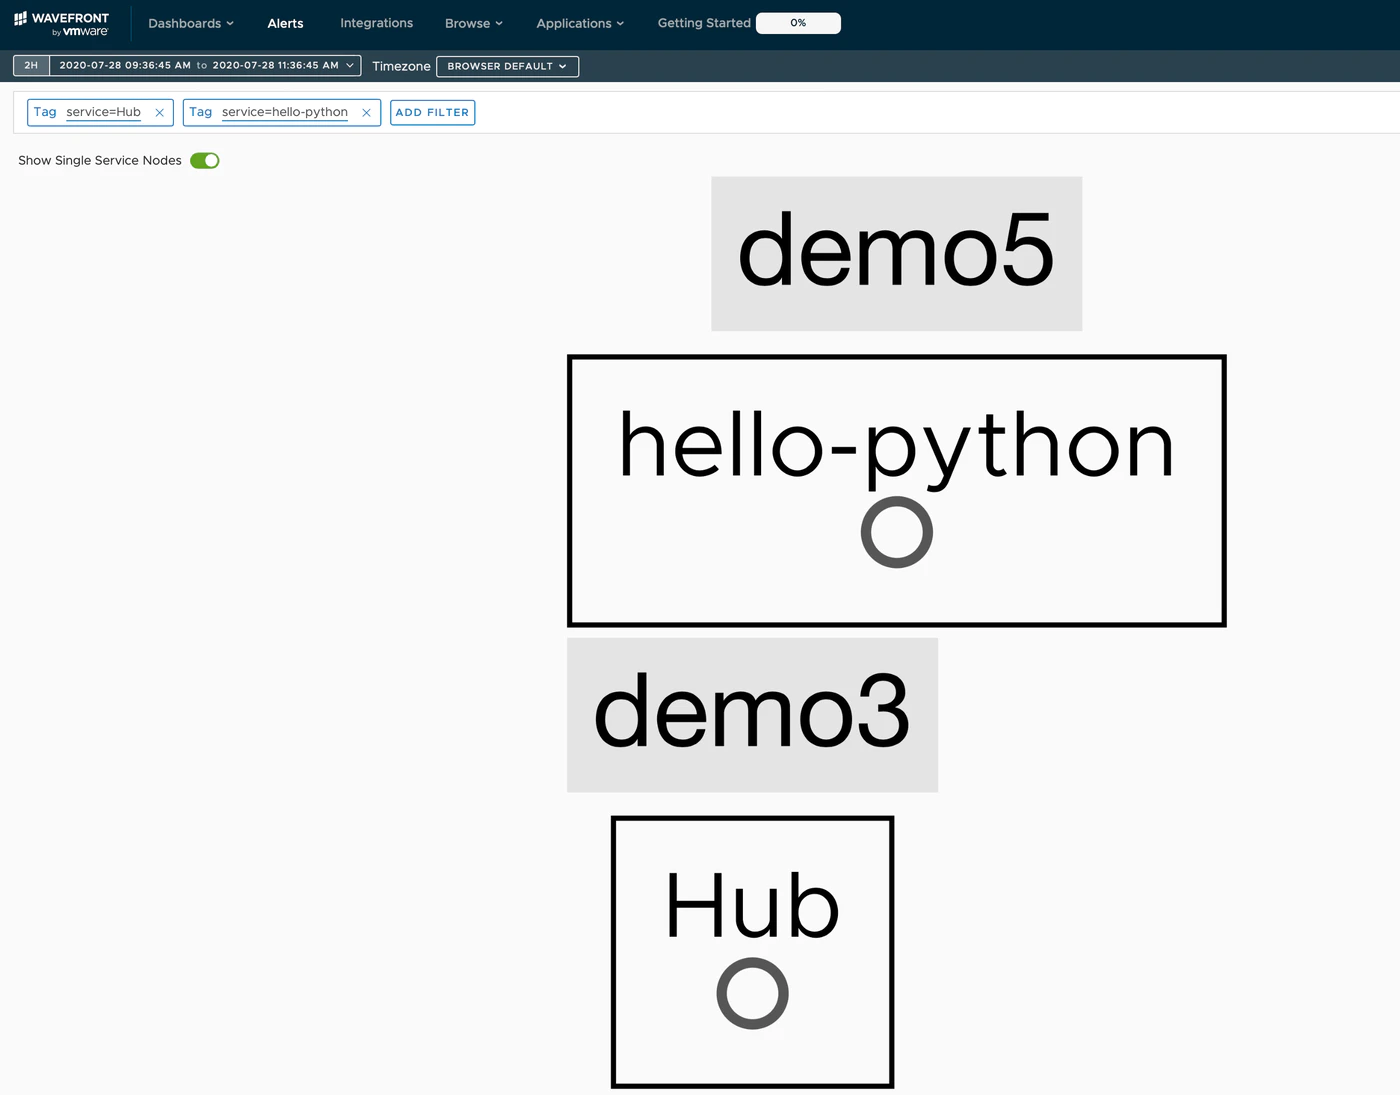
Why? Look at the Trace dashboard.
You can see the Trace IDs don't match between the two services.
In this example, hello-python has a3e9e320-d07a-11ea-a7cc-faffc269bbf7:
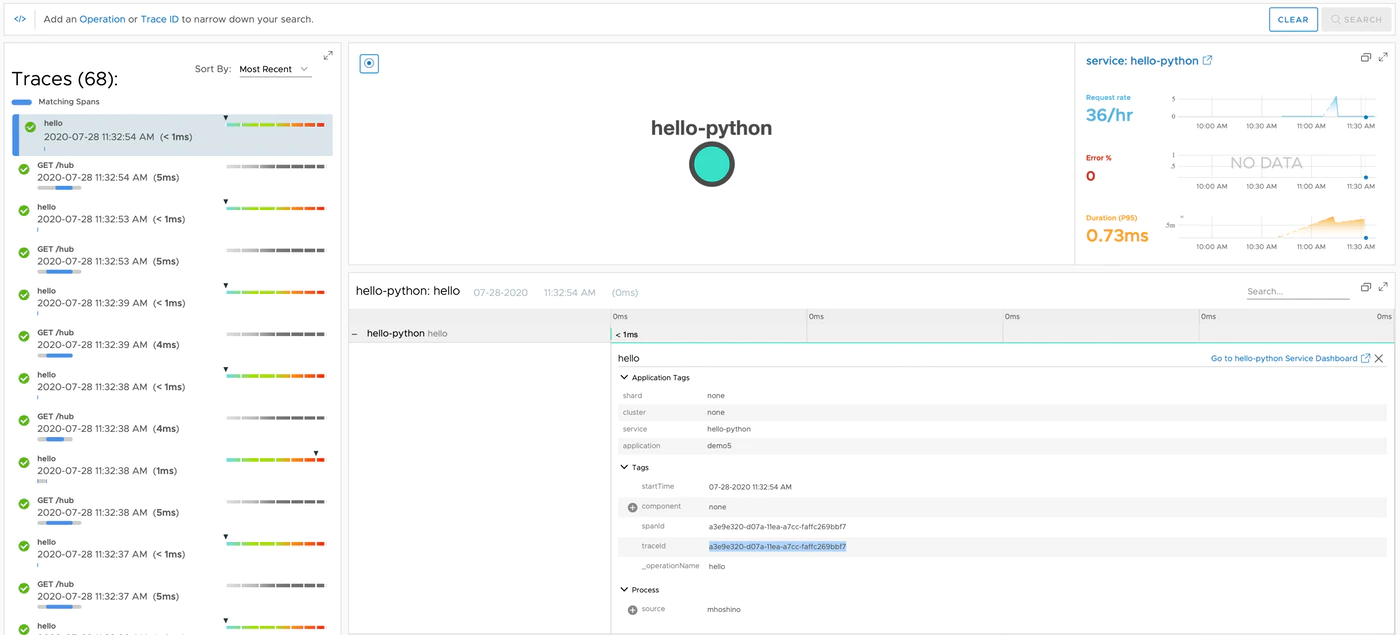 While the calling service has
 5f1f8e56-c571-7942-f160-b2c0d33116aa:
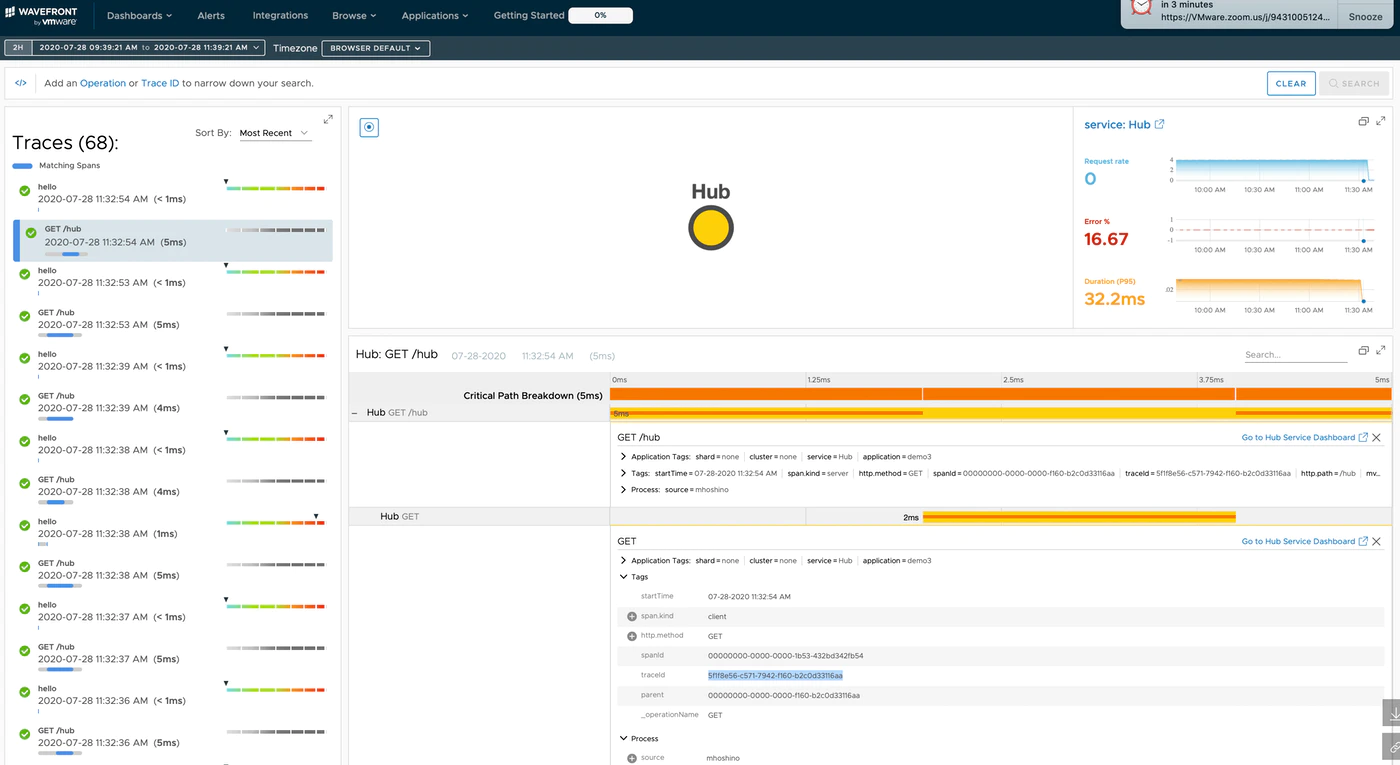
As summarized last time, services exchange Trace IDs with each other via HTTP headers. If the application doesn't unpack the Trace ID correctly, they appear as unrelated services. To avoid this, the code needs one more revision.
Fixing the code
Modify the Python code as follows:
from flask import Flask,request

# Set up sender
import opentracing

from wavefront_opentracing_sdk import WavefrontTracer
from wavefront_opentracing_sdk import span_context
from wavefront_opentracing_sdk.reporting import CompositeReporter
from wavefront_opentracing_sdk.reporting import ConsoleReporter
from wavefront_opentracing_sdk.reporting import WavefrontSpanReporter

import wavefront_sdk
import argparse
import uuid

app = Flask(__name__)

@app.route("/")
def hello():
    _BAGGAGE_PREFIX = 'x-b3-'
    _TRACE_ID = _BAGGAGE_PREFIX + 'traceid'
    _SPAN_ID = _BAGGAGE_PREFIX + 'spanid'
    _SAMPLE = _BAGGAGE_PREFIX + 'sample'

    trace_id = None
    span_id = None
    sampling = None
    baggage = {}
    for key, val in dict(request.headers).items():
        key = key.lower()
        if key == _TRACE_ID:
            trace_id = uuid.UUID(val.zfill(32))
        elif key == _SPAN_ID:
            span_id = uuid.UUID(val.zfill(32))
        elif key == _SAMPLE:
            sampling = bool(val == 'True')
        elif key.startswith(_BAGGAGE_PREFIX):
            baggage.update({strip_prefix(_BAGGAGE_PREFIX, key): val})
    if trace_id is None or span_id is None:
       span_ctx=None
    else:
       span_ctx = span_context.WavefrontSpanContext(trace_id, span_id, baggage,
                                                 sampling)
    # Create span1, return a newly started and activated Scope.
    with tracer.start_active_span('hello', child_of=span_ctx, ignore_active_span=True, finish_on_close=True):
      return "Hello World!"

def strip_prefix(prefix, key):
    """
    Strip the prefix of baggage items.
    :param prefix: Prefix to be stripped.
    :type prefix: str
    :param key: Baggage item to be striped
    :type key: str
    :return: Striped baggage item
    :rtype: str
    """
    return key[len(prefix):]


if __name__ == '__main__':
    parser = argparse.ArgumentParser()
    parser.add_argument('token')
    args = parser.parse_args()
    application_tag = wavefront_sdk.common.ApplicationTags(
        application='demo5',
        service='hello-python')
    # Create Wavefront Span Reporter using Wavefront Direct Client.
    direct_client = wavefront_sdk.WavefrontDirectClient(
        server="https://wavefront.surf",
        token=args.token,
        max_queue_size=50000,
        batch_size=10000,
        flush_interval_seconds=5)
    direct_reporter = WavefrontSpanReporter(direct_client)


    # Create Composite reporter.
    # Use ConsoleReporter to output span data to console.
    composite_reporter = CompositeReporter(
        direct_reporter, ConsoleReporter())

    # Create Tracer with Composite Reporter.
    tracer = WavefrontTracer(reporter=composite_reporter,
                             application_tags=application_tag)


    app.run(debug=True,host='0.0.0.0')
It got even longer, but restart the app after the fix:
python hello.py `cat ~/.wavefront_freemium`
And run curl for a while:
curl localhost:8083/hub
If it works, the services connect on the Wavefront screen:
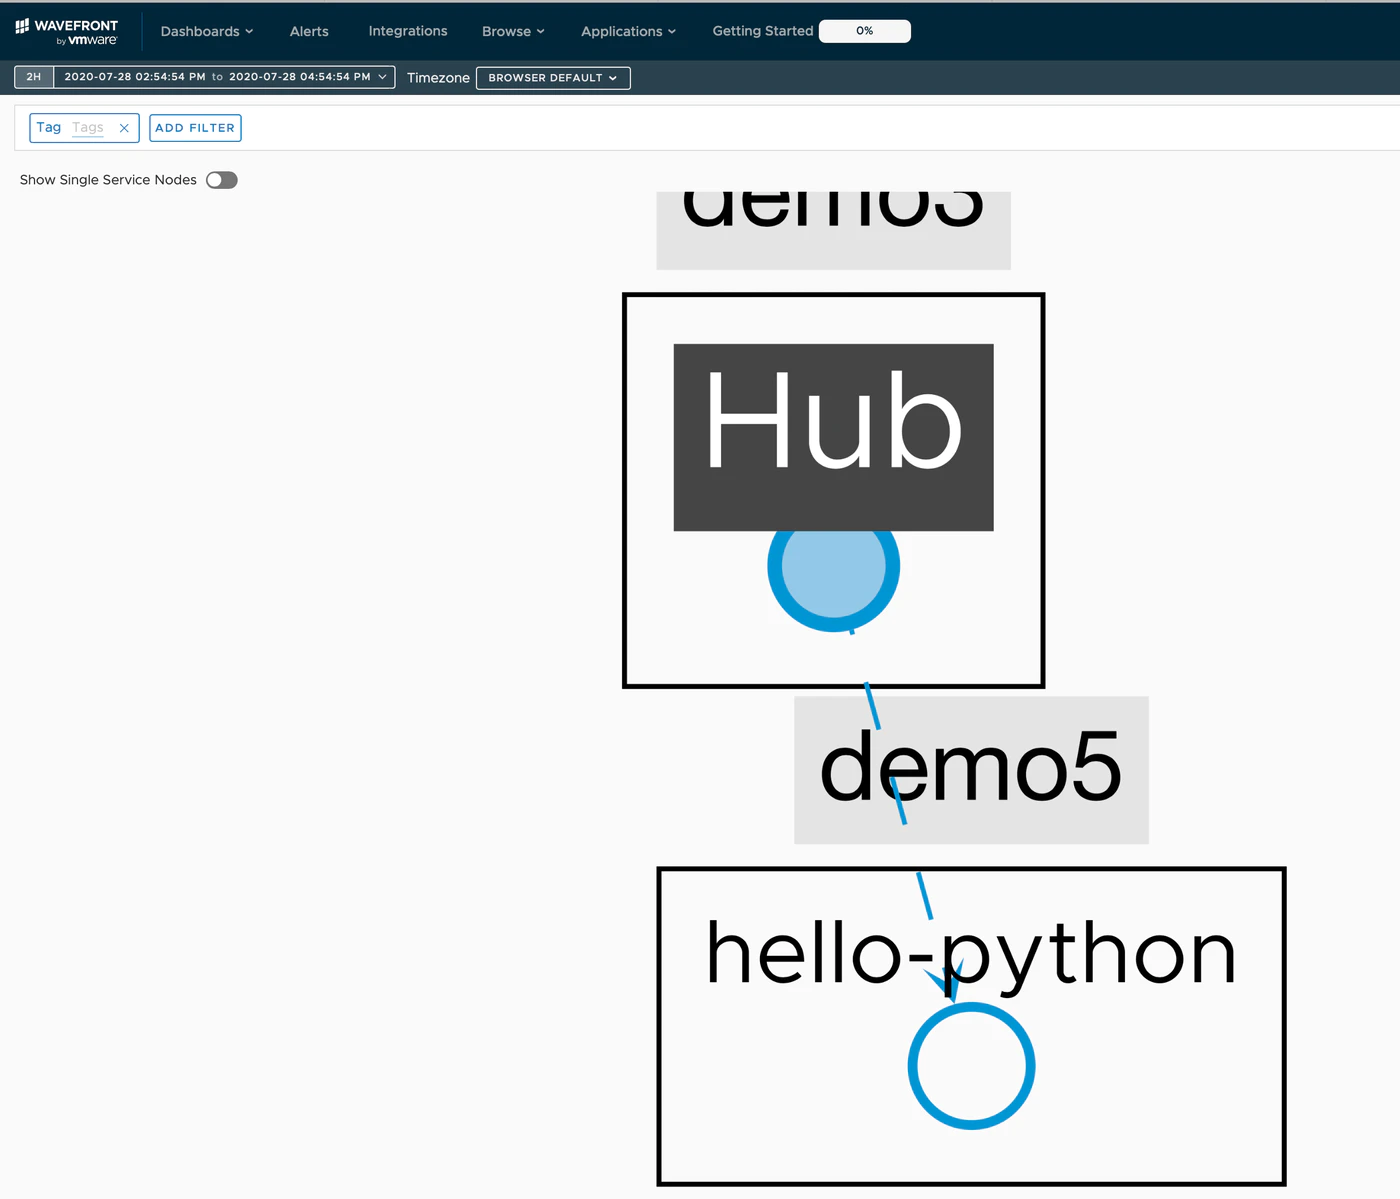
The part of the fixed code worth noting is below. This is where the HTTP headers are interpreted and the correct Trace ID extracted:
@app.route("/")
def hello():
...
    for key, val in dict(request.headers).items():

        key = key.lower()
        if key == _TRACE_ID:
            trace_id = uuid.UUID(val.zfill(32))
        elif key == _SPAN_ID:
            span_id = uuid.UUID(val.zfill(32))
        elif key == _SAMPLE:
            sampling = bool(val == 'True')
        elif key.startswith(_BAGGAGE_PREFIX):
            baggage.update({strip_prefix(_BAGGAGE_PREFIX, key): val})
Checking the Trace dashboard again, the connected services should now be recorded with the same Trace ID:
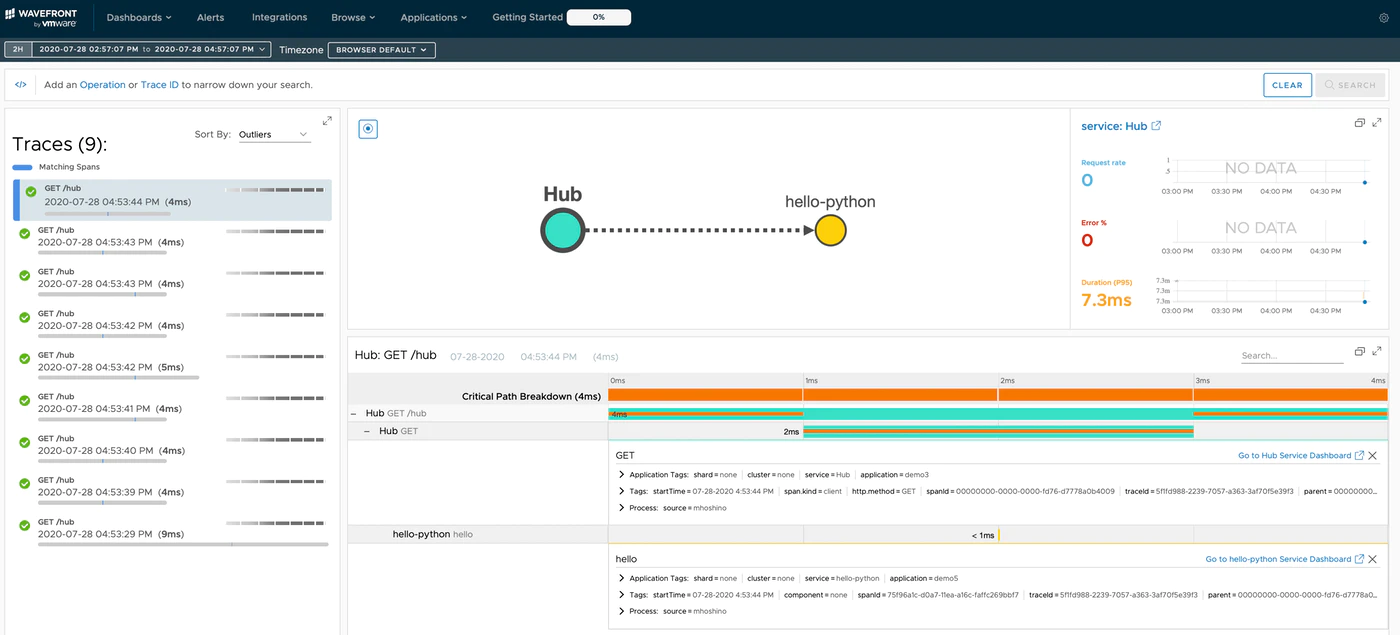
And that's how to connect services.
Summary
- To do distributed tracing, your code must explicitly state what you want traced
- When integrating with other services, you must extract the Trace ID from the incoming HTTP headers or they won't display as connected
This time we showed how distributed tracing can be done in another language without Spring Boot. Next: "Distributed tracing with AMQP".