Learning Distributed Tracing with Wavefront Part-4
· 13 min read
This is the fourth installment of the Learning Distributed Tracing with Wavefront series.
Series
Part 1 : Overview
Part 2 : Distributed tracing with Spring Boot
Part 3 : What are RED metrics?
Part 4 : Connecting services together ← you are here
Part 5 : Distributed tracing with Python
Part 6 : Distributed tracing with AMQP
Part 7 : Distributed tracing with a service mesh
Introduction
In Part 2 and Part 3 we watched distributed tracing with simple apps.
This time we connect two services and watch what happens.
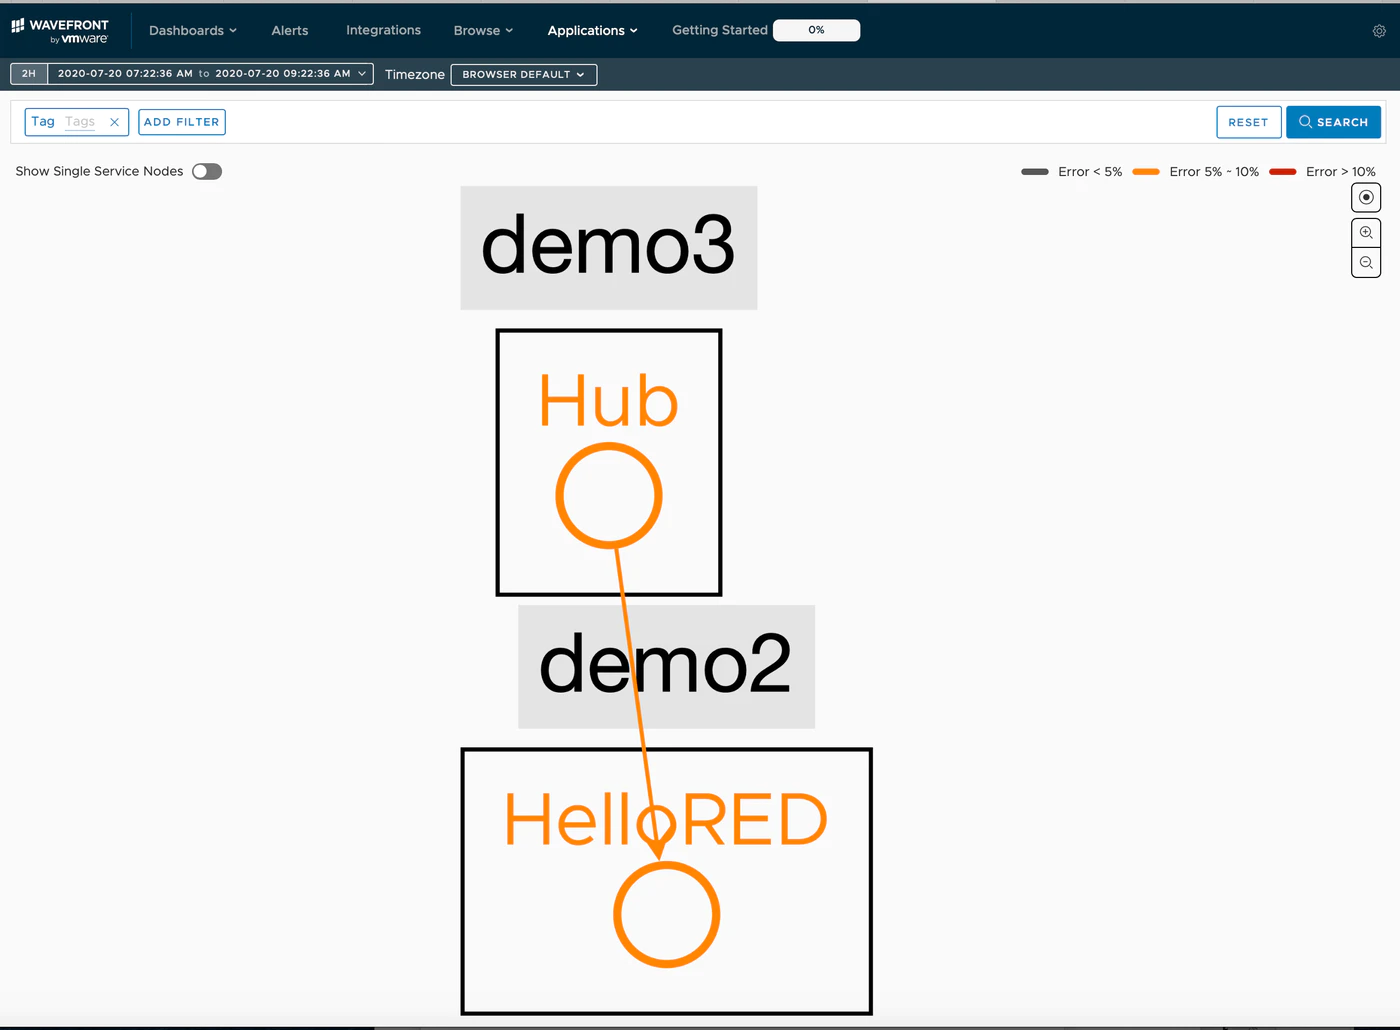
We're aiming for this:
Preparation
Build the app using the same steps as Part 2. If configured correctly, the following URL should show "Hello World" or "Good Bye World":
curl localhost:8082/hello
To avoid confusion, this article calls that app the RED app. In addition to the RED app, we'll build one more app and connect them.
The newly built one is called the HUB app.
Source code
Published here:
https://github.com/mhoshi-vm/wf-demanabu-dis-tracing/tree/master/4
Preparing the HUB app
Here's how to build the HUB app.
(It's practically boilerplate by now.) Once ready, access this URL:
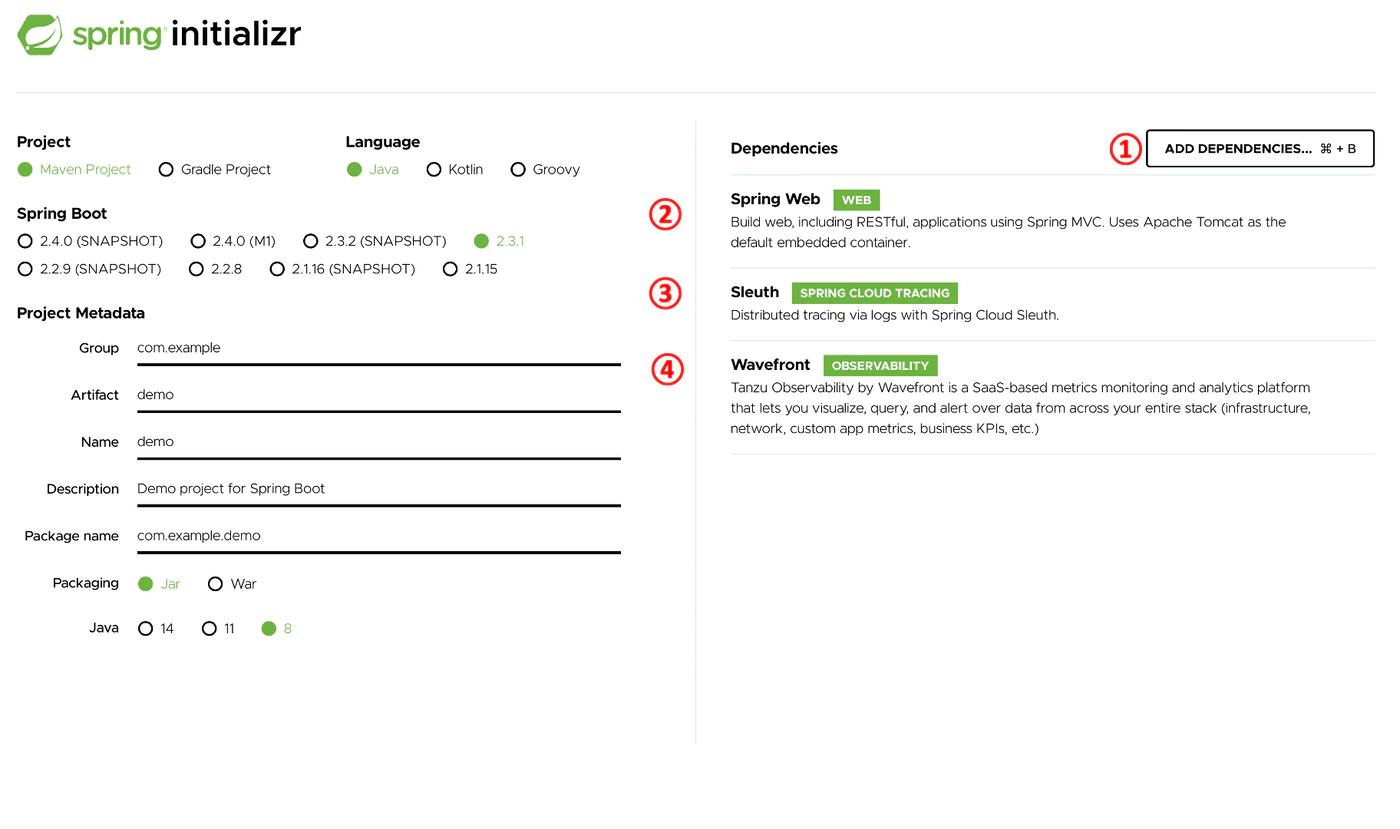
Then do the following:
- Select Add Dependencies
- Search for and add Spring Web
- Add Sleuth the same way
- Add Wavefront the same way
Finally click Generate. Extract the zip somewhere that doesn't overlap with the current app.
Open the following file in your favorite editor:
mhoshino@mhoshino demo % vi src/main/java/com/example/demo/DemoApplication.java
Replace it with this content:
package com.example.demo;

import java.util.Map;

import org.slf4j.Logger;
import org.slf4j.LoggerFactory;
import org.springframework.beans.factory.annotation.Autowired;
import org.springframework.beans.factory.annotation.Value;
import org.springframework.boot.SpringApplication;
import org.springframework.boot.autoconfigure.SpringBootApplication;
import org.springframework.context.annotation.Bean;
import org.springframework.core.ParameterizedTypeReference;
import org.springframework.http.HttpMethod;
import org.springframework.web.bind.annotation.GetMapping;
import org.springframework.web.bind.annotation.RequestHeader;
import org.springframework.web.bind.annotation.RestController;
import org.springframework.web.client.RestTemplate;

@SpringBootApplication
public class DemoApplication {

	public static void main(String[] args) {
		SpringApplication.run(DemoApplication.class, args);
	}

}

@RestController
class HubController{

    private static final Logger LOGGER = LoggerFactory.getLogger(HubController.class);

	@Value("${hub.urls}")
	private String urls;

    @Autowired
    RestTemplate restTemplate;

    @Bean
    public RestTemplate getRestTemplate() {
        return new RestTemplate();
    }

    @GetMapping(value="/hub")
    public String MultiRest(@RequestHeader Map<String, String> header) {
		printAllHeaders(header);

		for( String url : urls.split(",") )
		{
			LOGGER.info(String.format("URLS = %s", url));
			restTemplate.exchange(url, HttpMethod.GET, null, new ParameterizedTypeReference<String>() {}).getBody();
		}
        return "REST Complete";
    }

	private void printAllHeaders(Map<String, String> headers) {
		headers.forEach((key, value) -> {
			LOGGER.info(String.format("Header '%s' = %s", key, value));
		});
	}
}
Also open this file:
mhoshino@mhoshino demo % vi src/main/resources/application.properties
And append the following:
management.endpoints.web.exposure.include=wavefront
server.port=8083
wavefront.application.name=demo3
wavefront.application.service=Hub

hub.urls=http://localhost:8082/hello
That's it for code editing.
Connecting the services
Now start the apps. Run the following command for both the RED app and the HUB app. (Same command, so don't mix up the directories.)
./mvnw sprint-boot:run
Then run this command against the URL a few times:
curl localhost:8083/hub
After a while, log into the Wavefront URL:
http://localhost:8083/actuator/wavefront
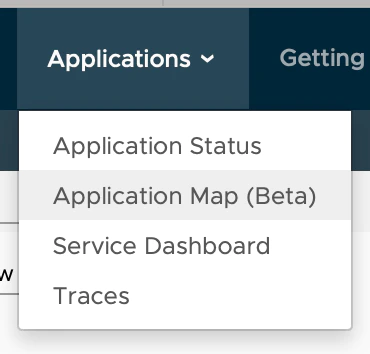
After logging into Wavefront, select [Applications] > [Application Map(Beta)].
If it worked, the diagram should be connected like this:
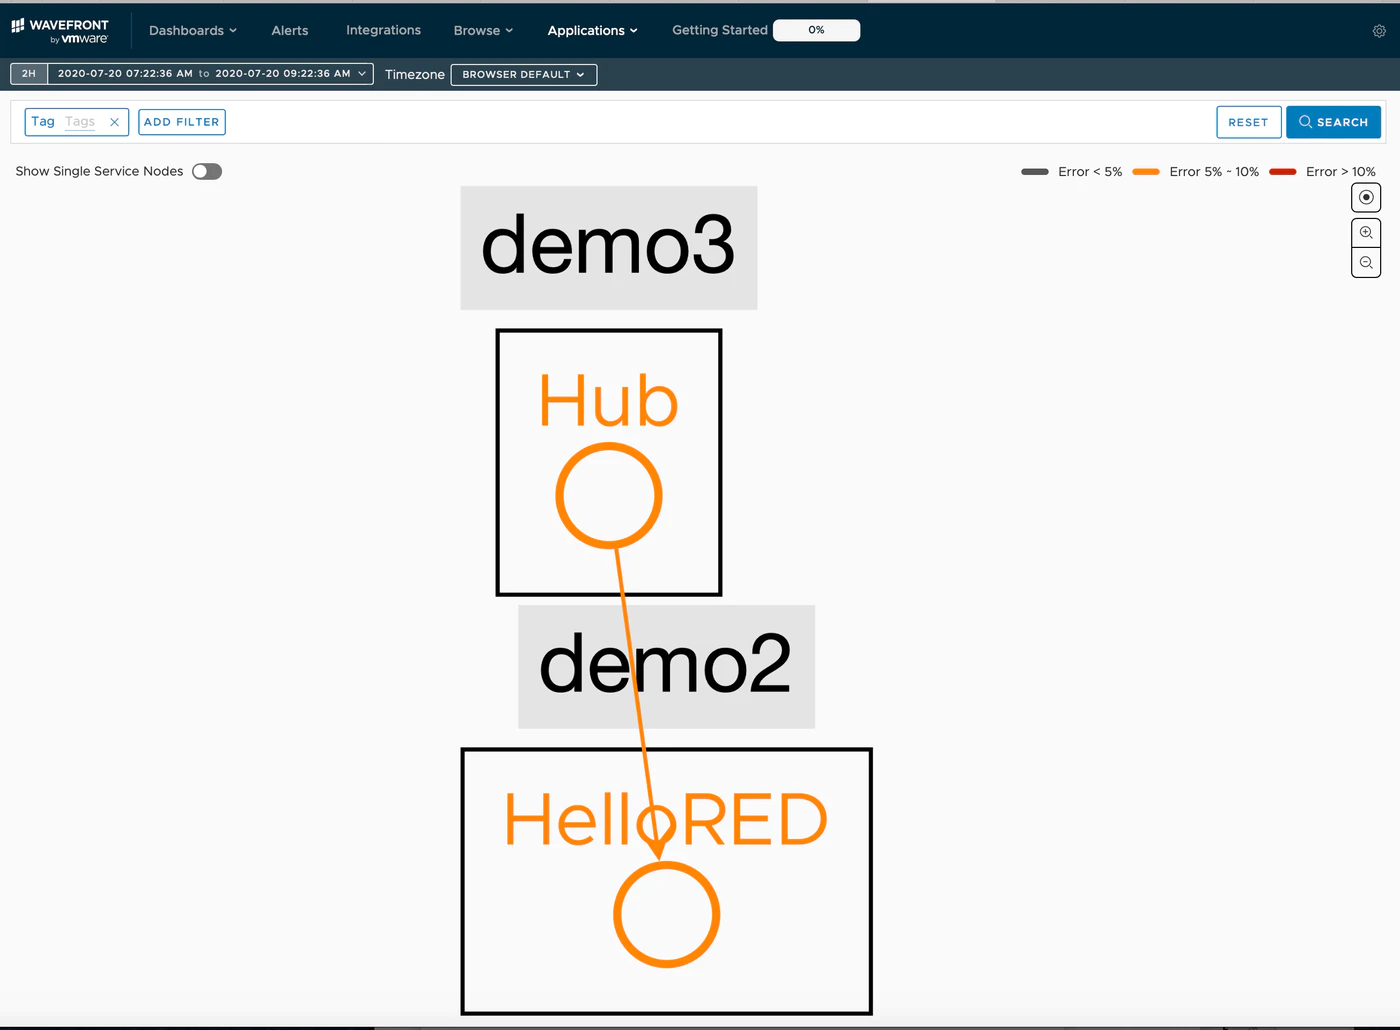
Opening [Applications] > [Traces] should show the Trace logs.
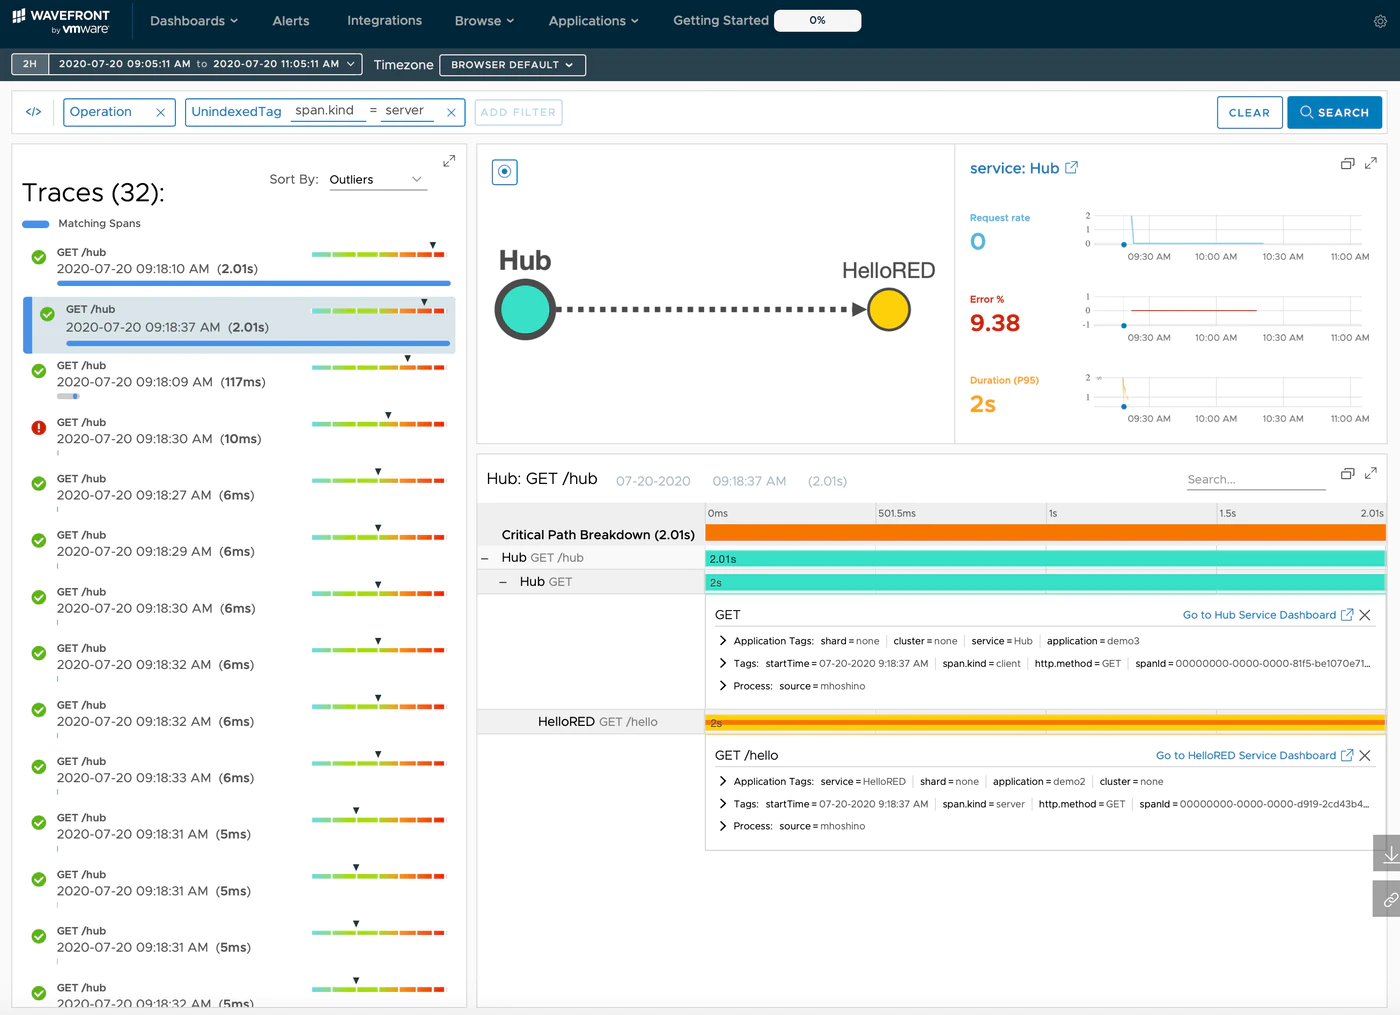
What's happening?
As usual, the explanation comes afterwards. The HUB app we built is very simple — it just sends a REST API call to the RED app from last time. In code, it's this part:
    @GetMapping(value="/hub")
    public String MultiRest(@RequestHeader Map<String, String> header) {
		printAllHeaders(header);

		for( String url : urls.split(",") )
		{
			LOGGER.info(String.format("URLS = %s", url));
			restTemplate.exchange(url, HttpMethod.GET, null, new ParameterizedTypeReference<String>() {}).getBody();
		}
        return "REST Complete";
    }
Which URL it calls is set by the hub.urls parameter in application.properties:
hub.urls=http://localhost:8082/hello
Let's look at the behavior in a little more detail.
Looking at the HUB app's logs, they should look like this:
2020-07-20 09:18:40.787  INFO [,5f14e2e08374d381d7534b5d89939527,d7534b5d89939527,true] 34562 --- [nio-8083-exec-2]
2020-07-20 09:18:40.787  INFO [,5f14e2e08374d381d7534b5d89939527,d7534b5d89939527,true] 34562 --- [nio-8083-exec-2]
2020-07-20 09:18:40.787  INFO [,5f14e2e08374d381d7534b5d89939527,d7534b5d89939527,true] 34562 --- [nio-8083-exec-2]
2020-07-20 09:18:40.787  INFO [,5f14e2e08374d381d7534b5d89939527,d7534b5d89939527,true] 34562 --- [nio-8083-exec-2]
Note the [,5f14e2e08374d381d7534b5d89939527,d7534b5d89939527,true] part — as explained in Part 1, 5f14e2e08374d381d7534b5d89939527 is the Trace ID
and d7534b5d89939527 is the Span ID.
Looking at the RED app's logs, they should look like this:
[hellorest,5f14e2e08374d381d7534b5d89939527,7ce53e353e48c2aa,true] 34007 --- [nio-8082-exec-2]
[hellorest,5f14e2e08374d381d7534b5d89939527,7ce53e353e48c2aa,true] 34007 --- [nio-8082-exec-2]
[hellorest,5f14e2e08374d381d7534b5d89939527,7ce53e353e48c2aa,true] 34007 --- [nio-8082-exec-2]
[hellorest,5f14e2e08374d381d7534b5d89939527,7ce53e353e48c2aa,true] 34007 --- [nio-8082-exec-2]
The things to note here:
- The Trace ID
5f14e2e08374d381d7534b5d89939527matches - The Span ID differs between the RED app and the HUB app
Further, looking to the right side of these logs, you should see:
2020-07-20 09:18:40.789  INFO Header 'accept' = text/plain, application/json, application/*+json, */*
2020-07-20 09:18:40.789  INFO Header 'x-b3-traceid' = 5f14e2e08374d381d7534b5d89939527
2020-07-20 09:18:40.789  INFO Header 'x-b3-spanid' = 067b8ed01abdb759
2020-07-20 09:18:40.789  INFO Header 'x-b3-parentspanid' = d7534b5d89939527
2020-07-20 09:18:40.789  INFO Header 'x-b3-sampled' = 1
2020-07-20 09:18:40.789  INFO Header 'user-agent' = Java/14.0.1
2020-07-20 09:18:40.789  INFO Header 'host' = localhost:8082
2020-07-20 09:18:40.789  INFO Header 'connection' = keep-alive
This prints the HTTP headers that arrived from the HUB app. From this we learn:
- x-b3-trace-id contains the Trace ID
- x-b3-parentspanid contains the HUB app's Span ID
x-b3?
So what on earth is x-b3? It's b3-propagation — HTTP headers defined by Zipkin for sharing Trace information.
For details, see here.
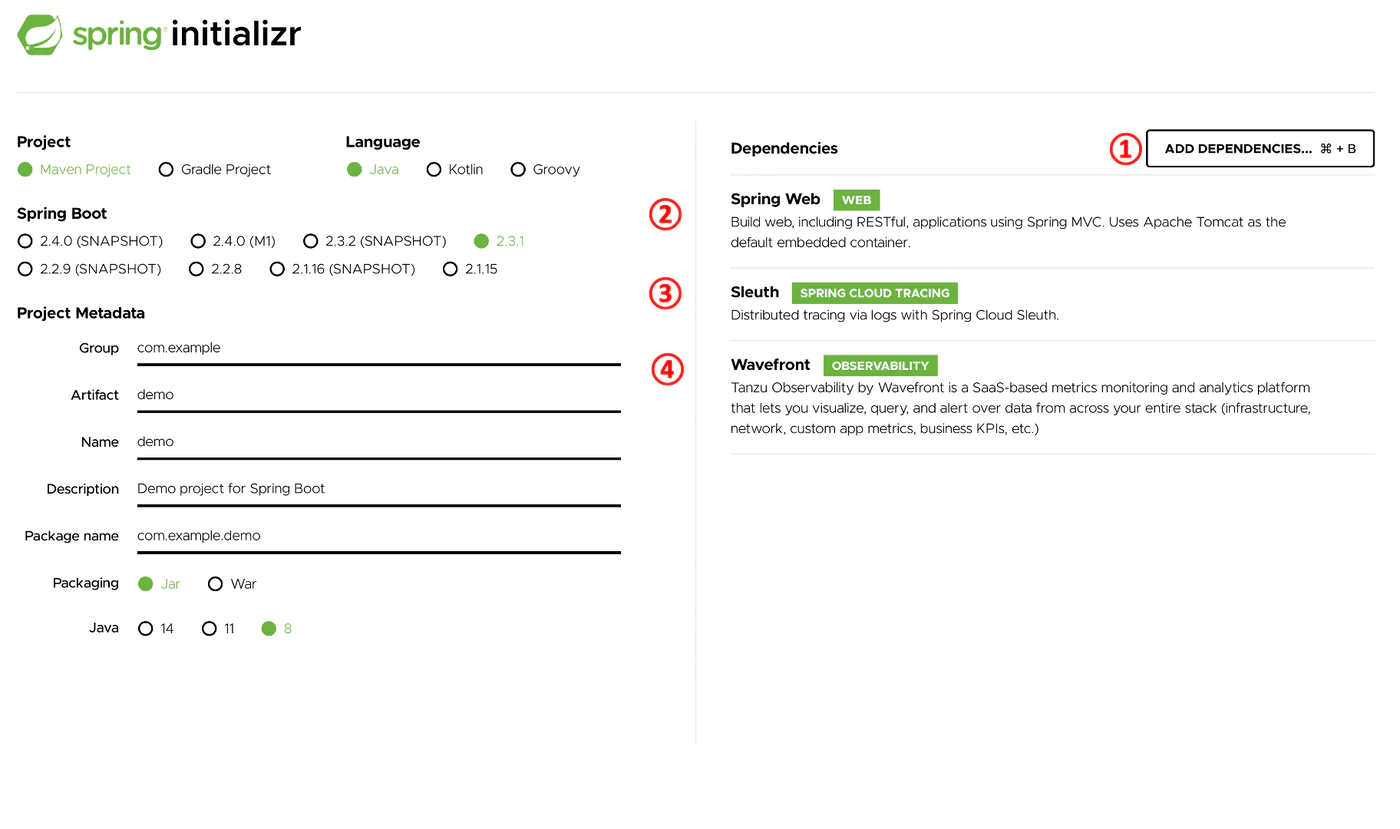
In Spring Boot, Sleuth handles unpacking these x-b3 headers from upstream and inserting them downstream, almost transparently to the code. It's what we defined at ③ below:
Summary
- To connect services in Spring Boot, simply making REST API calls is enough
- Services exchange Trace IDs and Span IDs via the HTTP "x-b3-*" headers
- In Spring Boot, Sleuth takes care of the "x-b3-*" headers for you — delightful
Next time, we'll see just how fiddly handling these x-b3 headers can be, using Python. Next: "Distributed tracing with Python".