Learning Distributed Tracing with Wavefront Part-3
· 10 min read
This is the third installment of the Learning Distributed Tracing with Wavefront series.
Series
Part 1 : Overview
Part 2 : Distributed tracing with Spring Boot
Part 3 : What are RED metrics? ← you are here
Part 4 : Connecting services together
Part 5 : Distributed tracing with Python
Part 6 : Distributed tracing with AMQP
Part 7 : Distributed tracing with a service mesh
Introduction
Last time we did distributed tracing with a simple app in Wavefront, and you probably saw this screen:
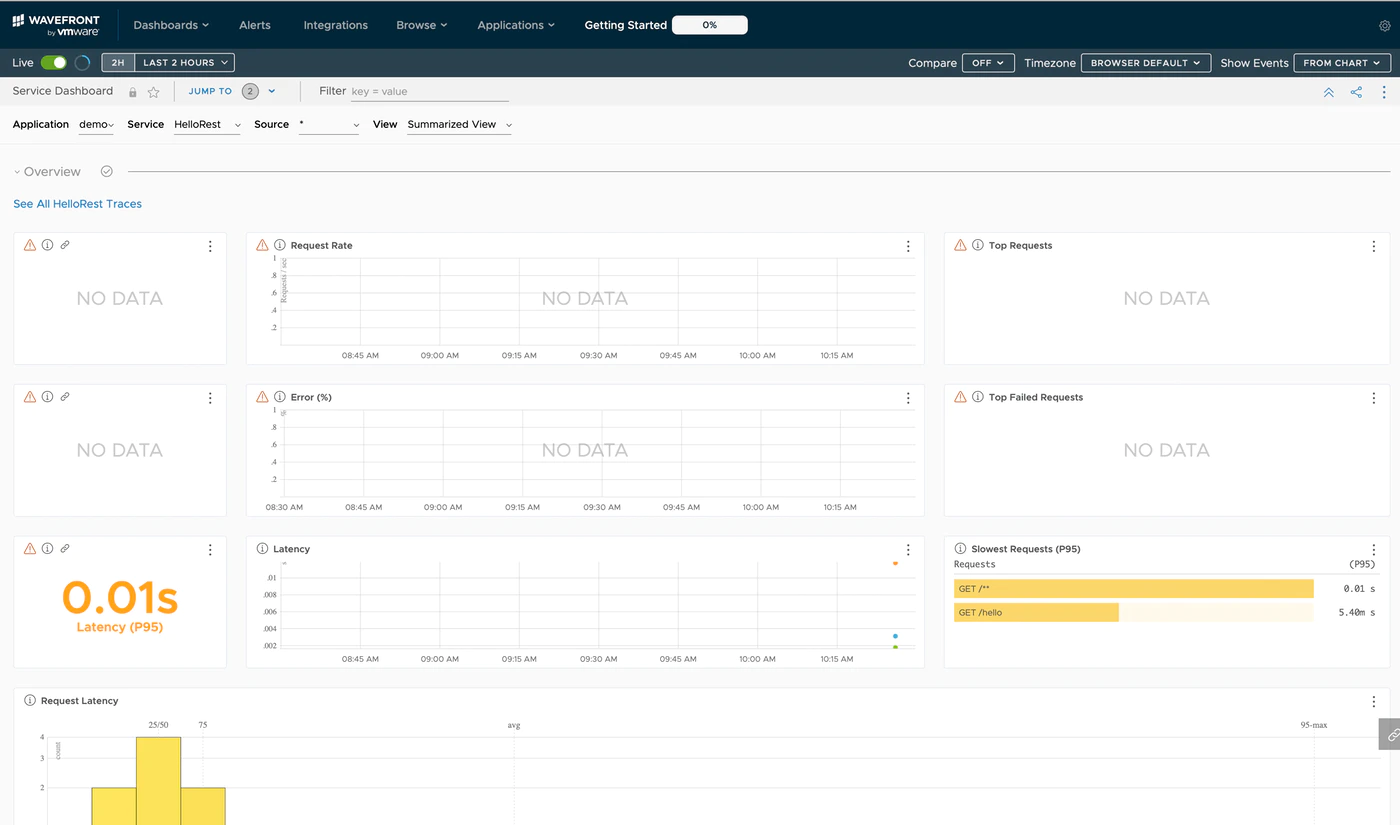
The first pane consists of three rows, and it is built on RED metrics.
RED metrics stands for Rate, Error, Duration — a concept originally proposed by Tom Wilkie of Weaveworks.
Wavefront displays the RED metrics of each service's distributed traces so each can be measured. Duration shows an unfamiliar P95 label — this represents the 95th percentile. To explain very roughly: of all requests that came in, it shows the one at the 95% mark of slowness.
Now, the previous demo probably didn't show anything interesting for Error or Duration. This time we deepen our understanding of RED a bit.
The steps from here are mostly the same as last time, with subtle differences.
Preparation
Spring Boot is a Java framework. So at minimum you need:
- Java JDK 8+
Install the JDK following Oracle JDK.
Source code
Published here:
https://github.com/mhoshi-vm/wf-demanabu-dis-tracing/tree/master/3
Preparing the app
Once ready, access this URL:
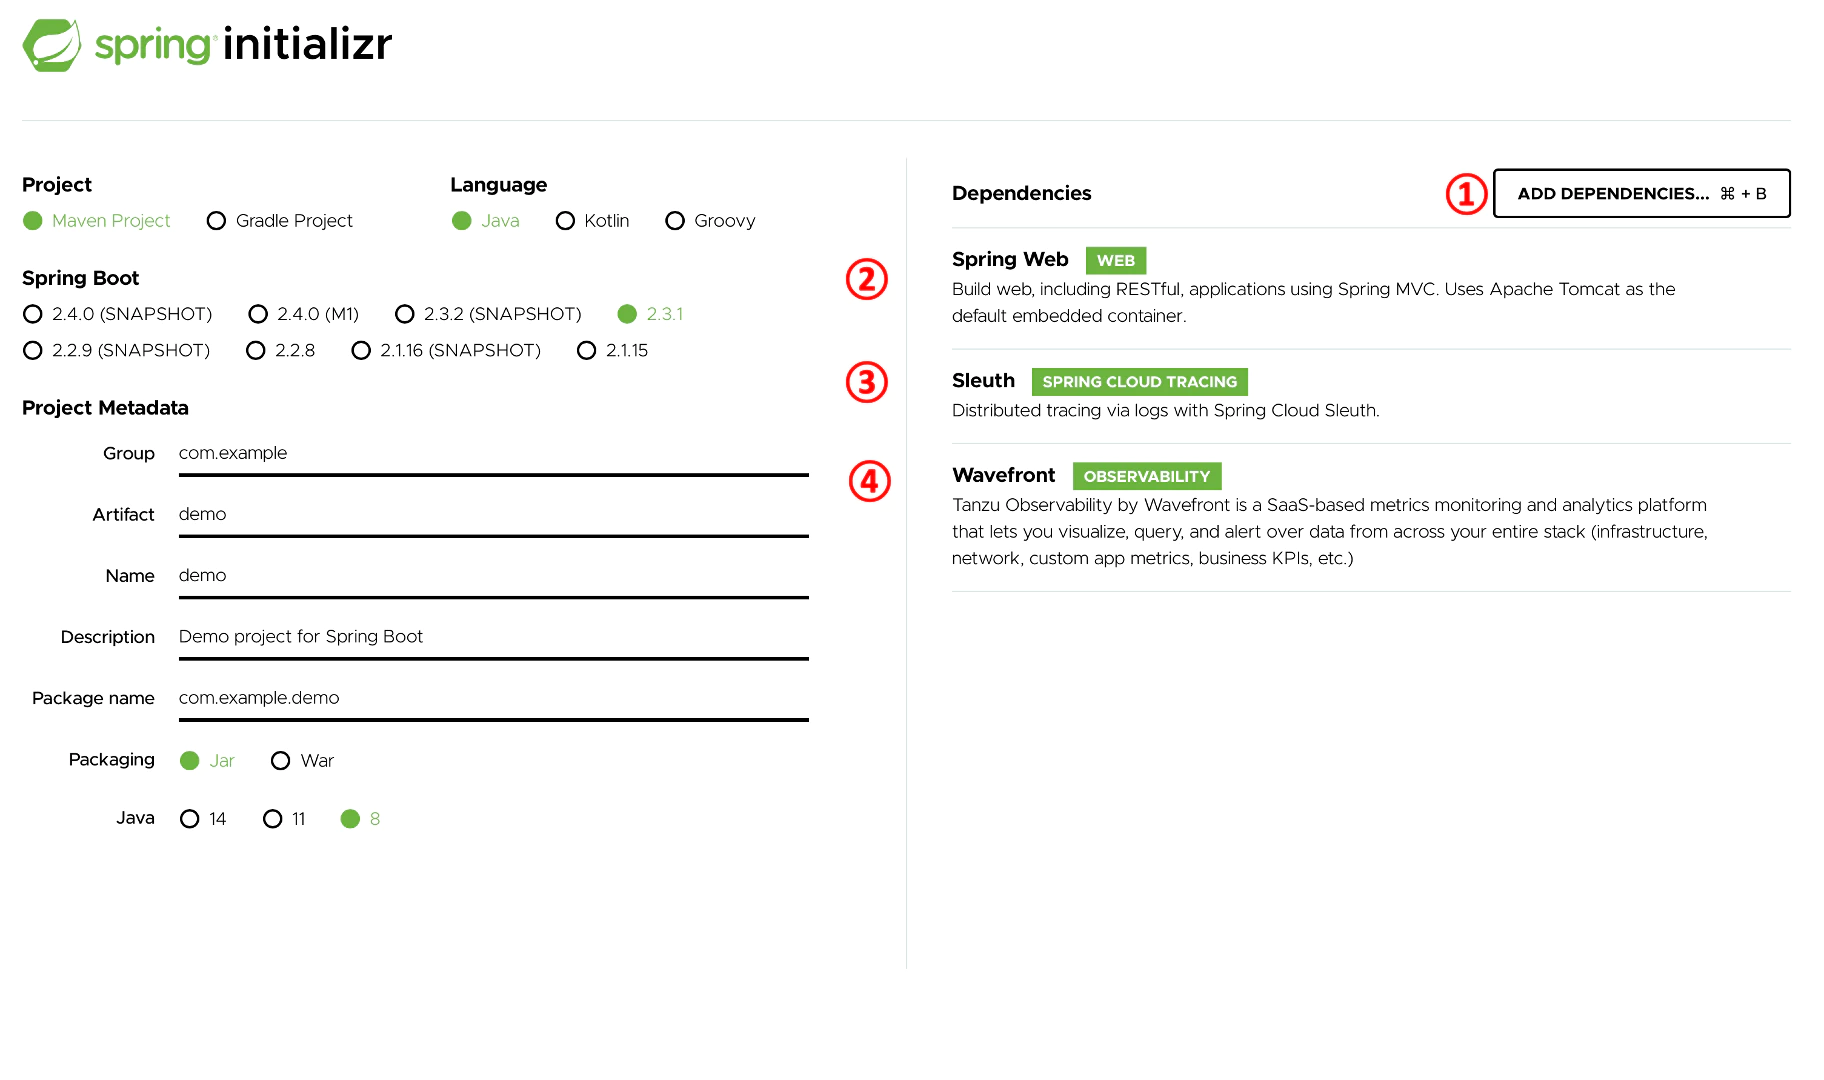
Then do the following:
- Select Add Dependencies
- Search for and add Spring Web
- Add Sleuth the same way
- Add Wavefront the same way
Finally click Generate. A zip file downloads; extract it anywhere you like.
Open the following file in your favorite editor:
mhoshino@mhoshino demo % vi src/main/java/com/example/demo/DemoApplication.java
Replace it with this content:
package com.example.demo;

import java.util.Map;

import org.slf4j.Logger;
import org.slf4j.LoggerFactory;
import org.springframework.boot.SpringApplication;
import org.springframework.boot.autoconfigure.SpringBootApplication;
import org.springframework.http.ResponseEntity;
import org.springframework.web.bind.annotation.GetMapping;
import org.springframework.web.bind.annotation.RequestHeader;
import org.springframework.web.bind.annotation.RestController;

@SpringBootApplication
public class DemoApplication {

	public static void main(String[] args) {
		SpringApplication.run(DemoApplication.class, args);
	}

}

@RestController
class HelloRestController {

	private static final Logger LOGGER = LoggerFactory.getLogger(HelloRestController.class);

        @GetMapping("/hello")
        public ResponseEntity<String> hello (@RequestHeader Map<String, String> header) throws InterruptedException{

                printAllHeaders(header);

                // Generate bad request 10%
                if ((long)(Math.random()*10%10) == 1) {
                    return ResponseEntity.badRequest().body("Good Bye World!");
                }
                int randomNumber = (int) (Math.random()*100);

                if (randomNumber > 97) {
                    // Wait for 5 seconds in 2%
                    Thread.sleep(5000);
                }else if (randomNumber > 90) {
                    // Wait for 2 seconds in 10%
                    Thread.sleep(2000);
                }
                return ResponseEntity.ok("Hello World!");
        }

	private void printAllHeaders(Map<String, String> headers) {
		headers.forEach((key, value) -> {
			LOGGER.info(String.format("Header '%s' = %s", key, value));
		});
	}
}
Also open this file:
mhoshino@mhoshino demo % vi src/main/resources/application.properties
And append the following:
management.endpoints.web.exposure.include=wavefront
server.port=8082
wavefront.application.name=demo2
wavefront.application.service=HelloRED
That's it for code editing.
Trying it
Now let's run the application. Execute the following command:
mhoshino@mhoshino demo % ./mvnw spring-boot:run
If all goes well, the application starts without errors. Open another prompt and run the following command for a while:
watch -n 0.1 curl localhost:8082/hello
After letting it run about five minutes, let's look at the service dashboard. As before, it should be reachable at:
https://localhost:8082/actuator/wavefront
Analyzing RED
After a while, it should look roughly like this:
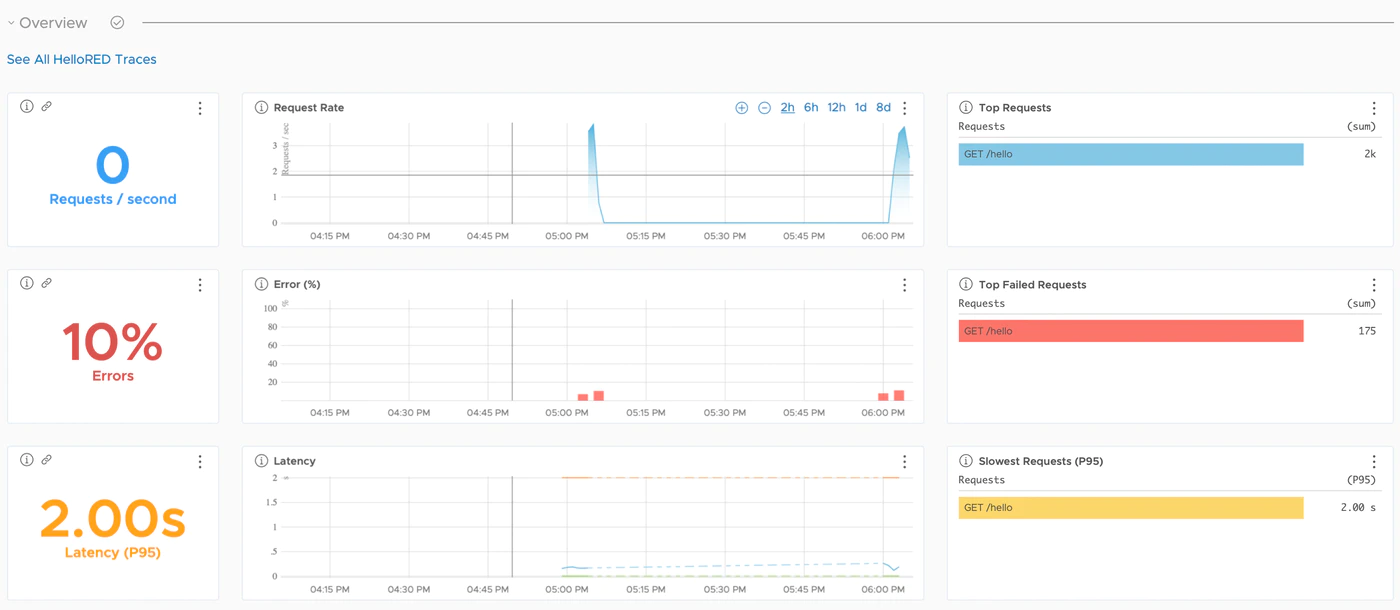
Now let's cross-reference this result against the actual code. First, look at the Error value:
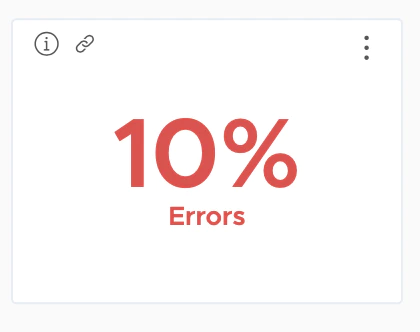
This is the result of the following code — in short, forcing an error with 10% probability:
                // Generate bad request 10%
                if ((long)(Math.random()*10%10) == 1) {
                    return ResponseEntity.badRequest().body("Good Bye World!");
                }
So this matches the result.
Now, the interesting part is the Duration (P95) result:
 The slowest reported value is 2 seconds, but here's the code behind it:
                if (randomNumber > 97) {
                    // Wait for 5 seconds in 2%
                    Thread.sleep(5000);
                }else if (randomNumber > 90) {
                    // Wait for 2 seconds in 10%
                    Thread.sleep(2000);
                }
Note that this code actually waits 5 seconds with 2% probability and 2 seconds with 10% probability.
Indeed, scrolling down a bit shows the 5-second waits are actually being detected:
 Yet, as the result shows, the 5-second waits are ignored. That's what "95th percentile" means: latencies occurring beyond the 95% mark are treated as outliers and ignored.
There are various schools of thought on this value, but what I want you to take away at this stage is that Wavefront can display this kind of analysis. (And for free.)
Summary
- RED metrics stands for Rate, Error, Duration
- Wavefront can analyze based on RED metrics too
- Wavefront can even display tricky results like the 95th percentile
Next: "Connecting services together".