Federating Multiple Prometheus Instances into One on TKG 1.3
· 8 min read
I consolidated the Prometheus instances on TKG into one
Introduction
The Tanzu Kubernetes Grid Extensions provided by VMware make it easy to install Prometheus. However, the manual only documents the following customization points:
Unfortunately, they don't cover all of Prometheus's capabilities. Does that mean we must give up on anything not written in the manual? No — we can wield ytt to inject arbitrary configuration. This post shows how. What we try here is Prometheus Federation.
Caution
Note that the following method is not yet officially supported.
Prerequisites
- Prometheus is installed following the official steps
- You have two or more Prometheus instances
- You roughly understand how YTT works. I recommend this link.
Steps
1. Prepare the update file
Prepare a file like the one below; /tmp/prometheus.yaml is fine for now.
The targets value is from my environment — put in the correct one for yours.
#@ load("@ytt:overlay", "overlay")
#@ load("@ytt:yaml", "yaml")

#@ def remote_write_config():
#@overlay/match missing_ok=True
#@overlay/match-child-defaults missing_ok=True
scrape_configs:
  #@overlay/append
  - job_name: 'federate'
    scrape_interval: 30s
    honor_labels: true
    metrics_path: '/federate'
    scheme: https
    tls_config:
      insecure_skip_verify: true
    params:
      match[]:
      - '{__name__=~".+"}'
    static_configs:
      - targets:
        - prom.demo.lespaulstudioplus.info
#@ end

#@overlay/match by=overlay.subset({"kind": "ConfigMap","metadata": {"name": "prometheus-server"}})
---
data:
  #@overlay/replace via=lambda a,_: yaml.encode(overlay.apply(yaml.decode(a), remote_write_config()))
  prometheus.yml:
2. Validate the configuration
Let's check that the configuration in the file above is fine. First move into the directory where you configured the Tanzu Extensions:
cd tkg-extensions-v1.3.1+vmware.1/monitoring/prometheus
Then enter the following command. Make sure the ytt command is installed on your machine beforehand.
ytt -f /common/ \
  -f ./ \
	-f /extensions/monitoring/prometheus/prometheus-data-values.yaml \
	-f /tmp/prometheus.yaml --ignore-unknown-comments | less
If the output shows remote_write added at the bottom of data.[prometheus.yml], that's the expected result.
apiVersion: v1
kind: ConfigMap
metadata:
  labels:
    component: server
    app: prometheus
  name: prometheus-server
  namespace: tanzu-system-monitoring
data:
# ...
  prometheus.yml: |
	  #....
	  scrape_configs:
			- job_name: federate
	      scrape_interval: ##
	      honor_labels: true
	      metrics_path: /federate
	      scheme: https
	      params:
	        match[]:
	        - '{__name__=~".+"}'
	      static_configs:
	      - targets:
	        - prom.demo.lespaulstudioplus.info
3. Register the file as a secret
Register the file you created as a secret like this:
kubectl create secret generic prometheus-update-yaml --from-file=prometheus-update-yaml=/tmp/prometheus.yaml -n tanzu-system-monitoring
If you see secret/prometheus-update-yaml created, move on.
4. Update the Extensions
Now update the Prometheus Extensions. Run the following command:
kubectl edit apps prometheus -n tanzu-system-monitoring -o yaml
Point template[0].ytt.inline.pathsFrom at the newly created Secret:
spec:
  deploy:
  - kapp:
      rawOptions:
      - --wait-timeout=5m
  fetch:
  - image:
      url: projects.registry.vmware.com/tkg/tkg-extensions-templates:v1.3.1_vmware.1
  serviceAccountName: prometheus-extension-sa
  syncPeriod: 5m0s
  template:
  - ytt:
      ignoreUnknownComments: true
      inline:
        pathsFrom:
        # !!!Update from here!!!!!!!!!
        - secretRef:
            name: prometheus-update-yaml
        #!!!!!!!!!!!!
        - secretRef:
            name: prometheus-data-values
      paths:
      - tkg-extensions/common
      - tkg-extensions/monitoring/prometheus
5. Confirm the configuration
After a while a Reconcile runs, so check the result. You can confirm with kubectl get apps prometheus -n tanzu-system-monitoring -o yaml and the like.
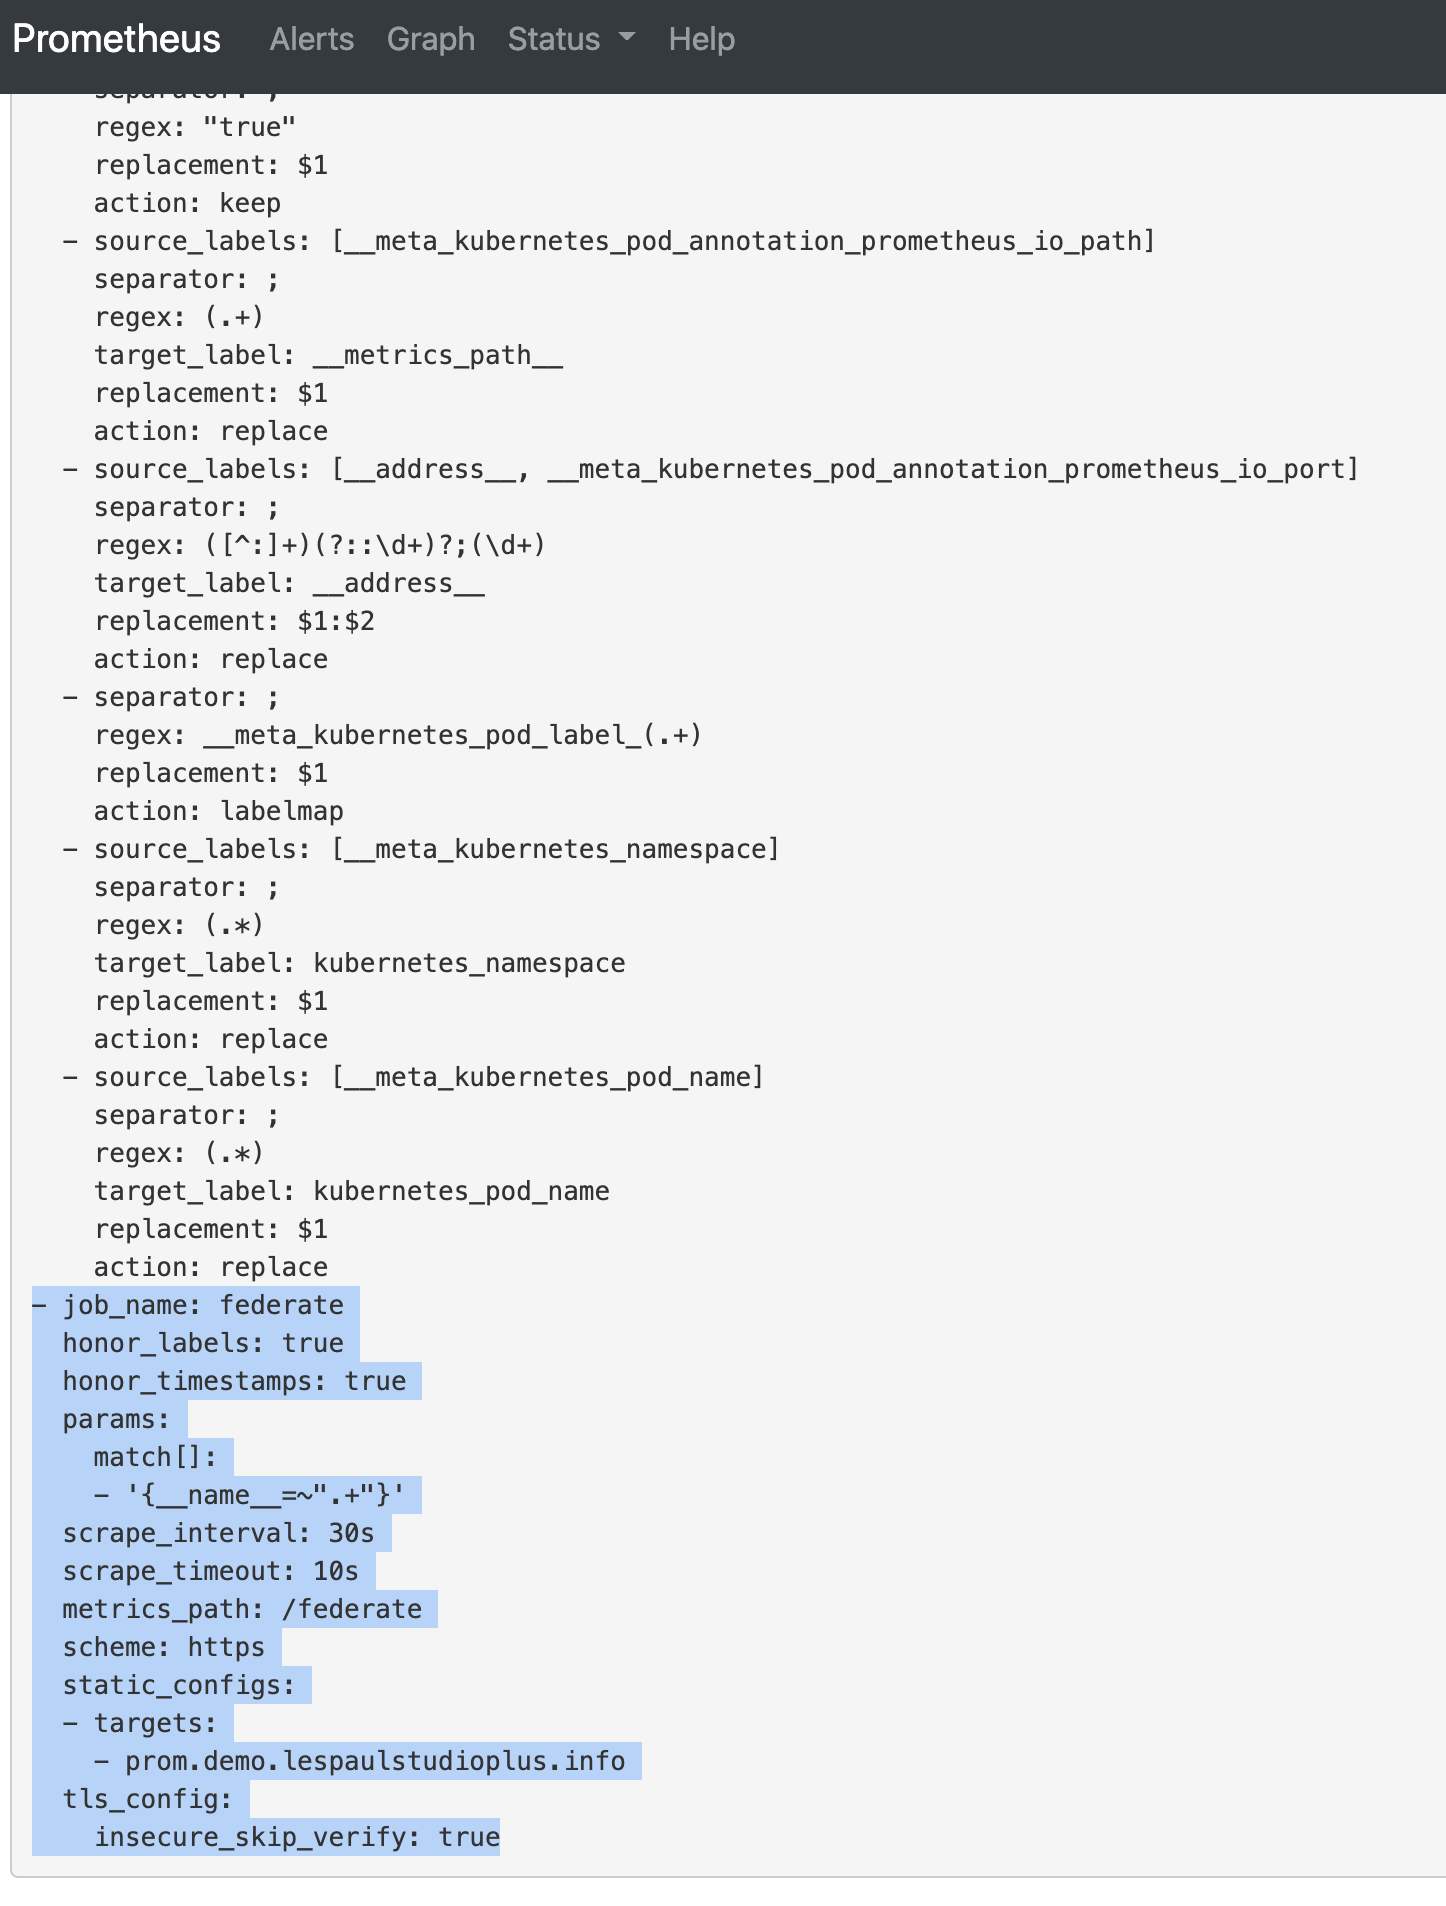
Once the Reconcile completes, verify the configuration. The quickest way is to access the Prometheus UI and check Status > Configuration.
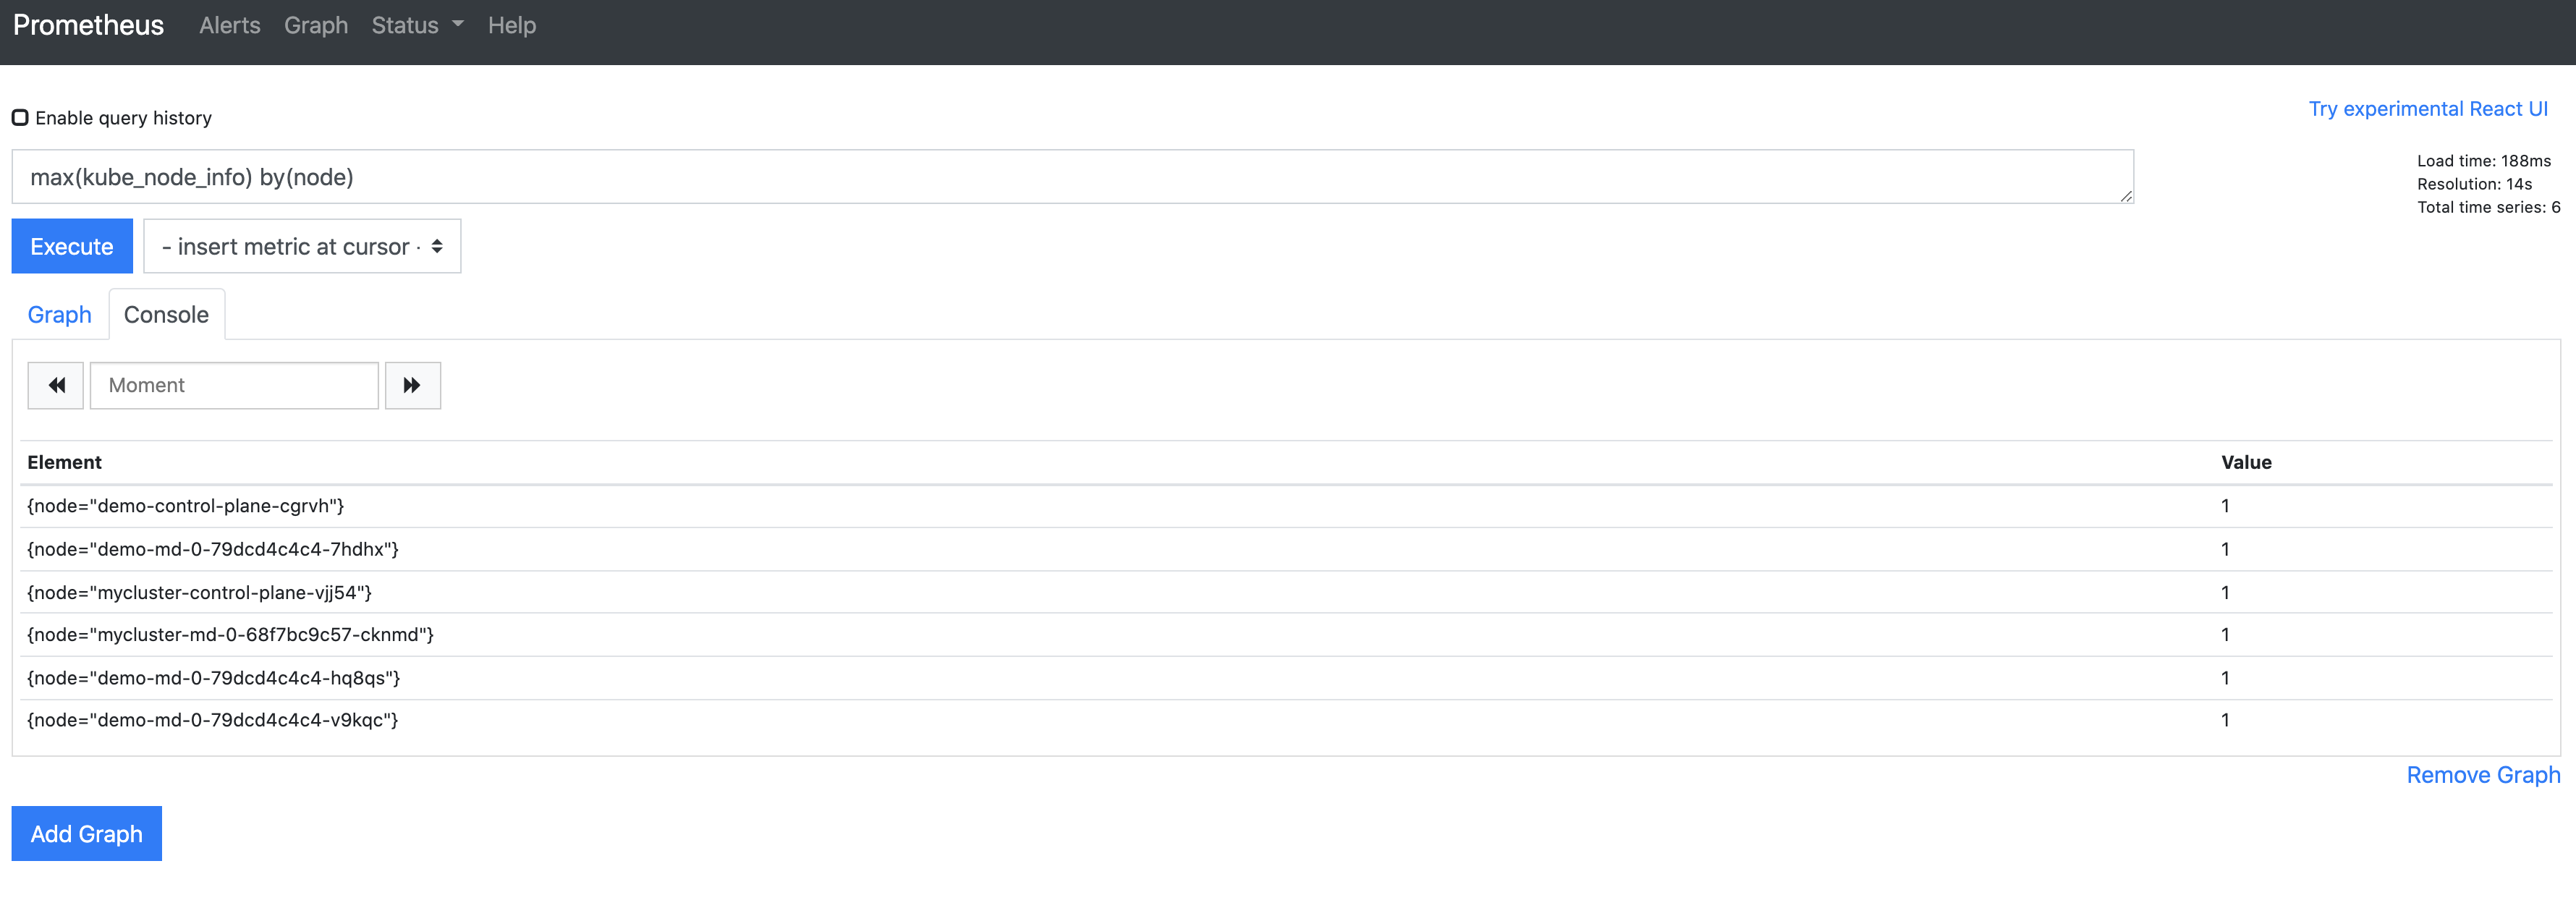
With this configuration, multiple Prometheus instances are aggregated in one place, so node_info shows up for all aggregated clusters. With the configuration below, both TKGs I created — "mycluster" and "demo" — are visible.
Summary
Applying YTT enables extended configuration such as Prometheus Federation.