Distributed Tracing with Wavefront + OpenTelemetry Auto Instrumentation
· 7 min read
With OpenTelemetry's Auto Instrumentation feature, distributed tracing becomes a breeze.
Introduction
A project called OpenTelemetry is currently gaining momentum in the CNCF space. It aims to make distributed tracing more accessible by creating specifications and conventions for it.
If you're wondering what distributed tracing is in the first place, see:
Learning Distributed Tracing with Wavefront
As introduced in this post, distributed tracing in scripting languages such as Python used to require many code changes, making the bar rather high.
Meanwhile, OpenTelemetry has been developing and shipping an Auto Instrumentation feature that requires almost no coding.
This post not only tries it out but also shows how to hook it up to Wavefront (aka Tanzu Observability).
Prerequisites
What you need this time:
- Python 3
See here for installation. As usual, no fancy editor is required.
Once Python is installed, create a virtualenv since we want to test dependencies locally only. Run the following in any directory:
virtualenv env
source env/bin/activate
You also need some kind of Wavefront account. If you want to stay free of charge, you can get a Freemium license via Spring Boot as described in this post.
Source code
Published here:
https://github.com/mhoshi-vm/wf-python-opentelemetry
Architecture
The architecture image looks like this:
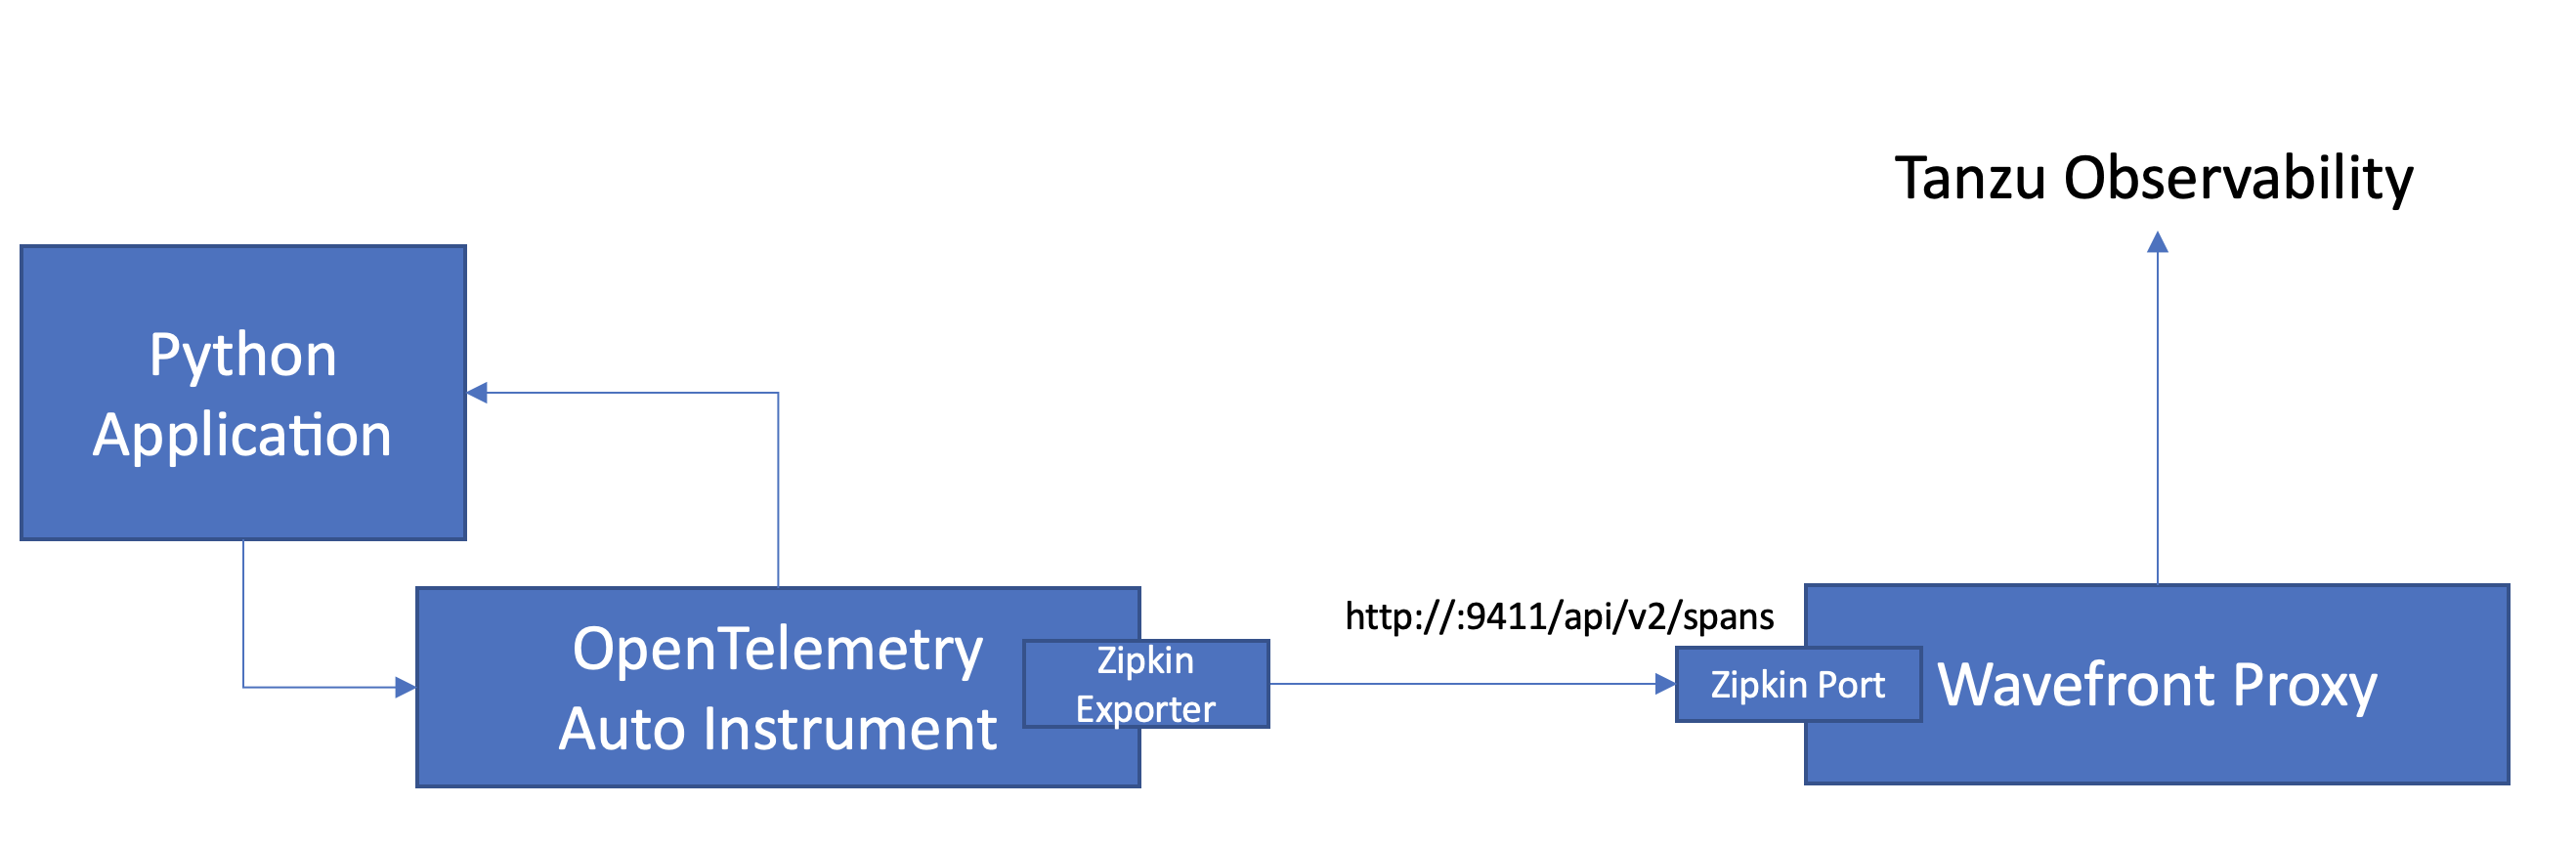
The key points:
- OpenTelemetry Auto Instrumentation monitors the Python application
- Traces/spans are forwarded using the OpenTelemetry Zipkin Exporter
- The Wavefront Proxy receives the traces on its Zipkin listen port
- The Wavefront Proxy forwards them to Tanzu Observability
Steps
Clone the repository
Anywhere is fine — clone the repository:
git clone https://github.com/mhoshi-vm/wf-python-opentelemetry
cd wf-python-opentelemetry
Install the Wavefront Proxy
Install the Wavefront Proxy following:
https://docs.wavefront.com/proxies_installing.html
It differs per OS; on MacOS, for example:
brew tap wavefrontHQ/wavefront
brew install wfproxy
Start the Wavefront Proxy
First, tweak wavefront_mon.conf a little:
vi wavefront_mod.conf
Set the following lines to your Wavefront account information:
server=https://wavefront.surf/
token=xxxx
Then start the Wavefront Proxy with:
wfproxy -f wavefront_mod.conf
Continue working in another prompt.
Install the Python dependencies
Install the dependencies with the command below. Note that at the time of writing, things only worked when all OpenTelemetry-related libraries were pinned to version 0.17b0.
pip install -r requirements.txt
Start the application
First, about the app itself — it's an ultra-simple Hello World, as you can see. There is zero distributed tracing logic in the code.
from flask import Flask

app = Flask(__name__)

@app.route("/")
def hello():
    return "Hello World!"

if __name__ == '__main__':
    app.run(debug=True,host='0.0.0.0')
Before starting, export these environment variables:
export OTEL_EXPORTER=zipkin
export OTEL_EXPORTER_ZIPKIN_ENDPOINT=http://localhost:9411/api/v2/spans
export OTEL_SERVICE_NAME="hello"
And finally start the app with:
opentelemetry-instrument python3 ./hello.py
Once it's up, hit it a few times with curl from another prompt:
curl localhost:5000
Checking the result
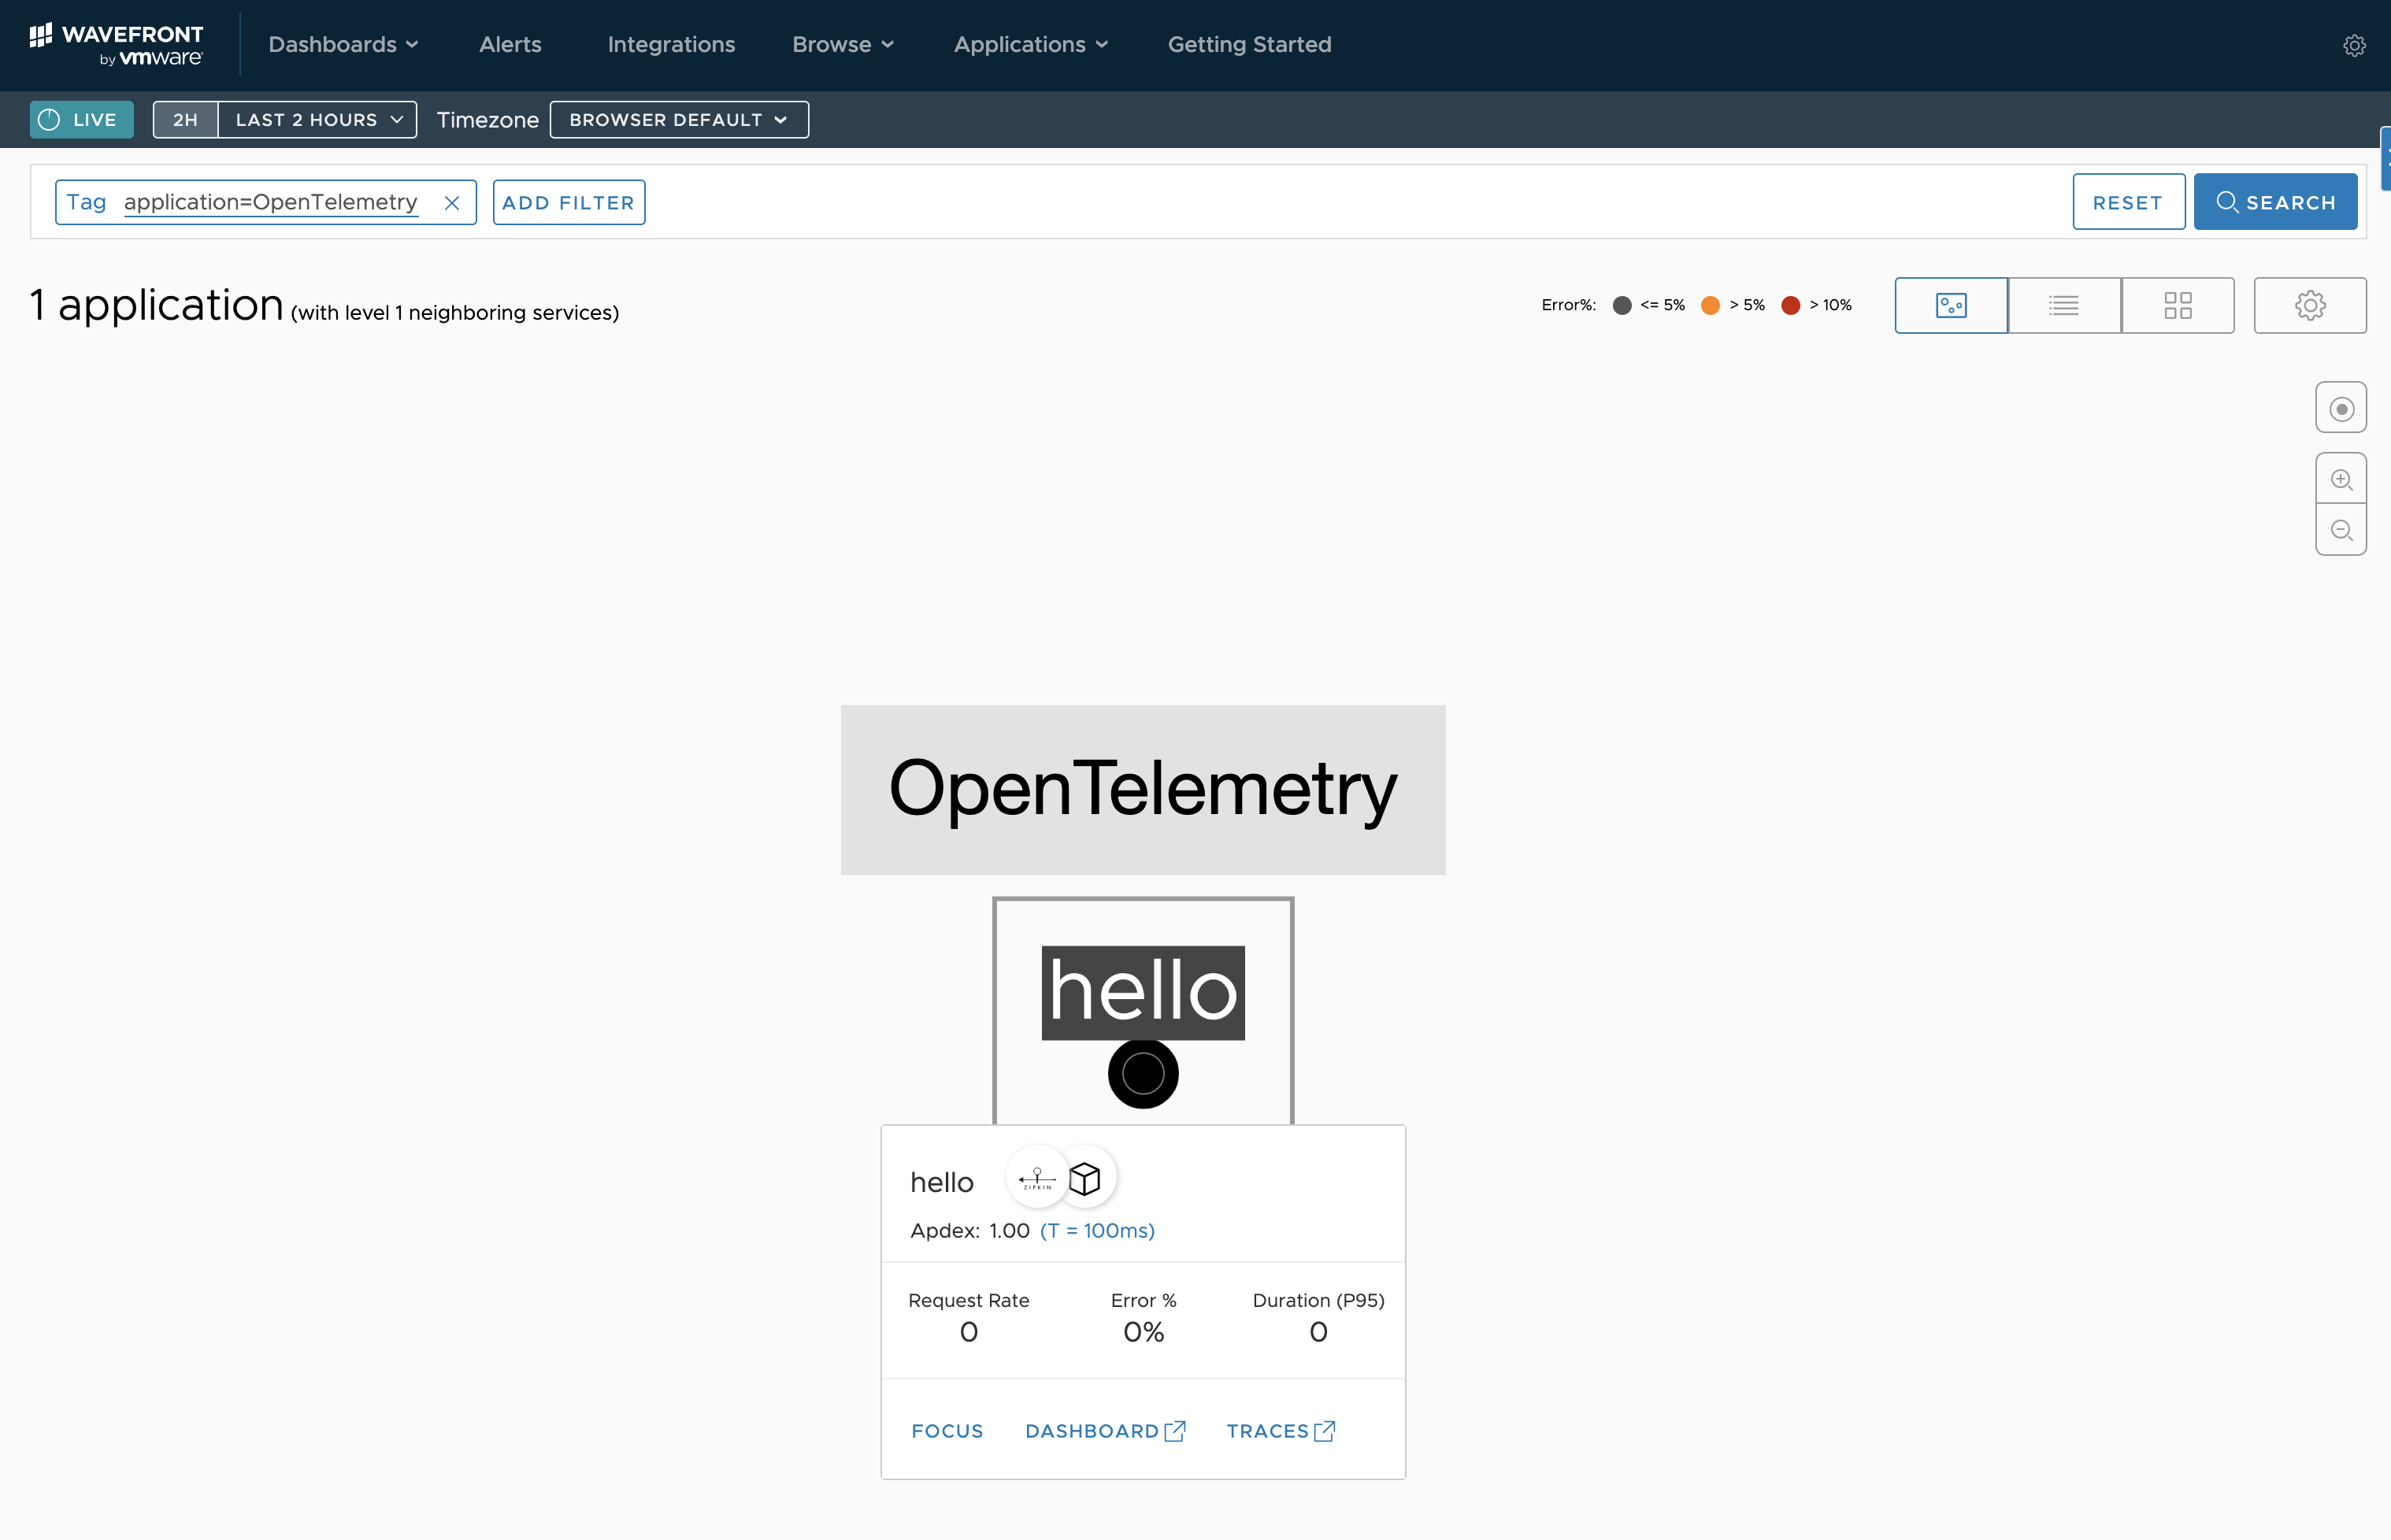
Log into Wavefront. If it worked, trace information appears like this:
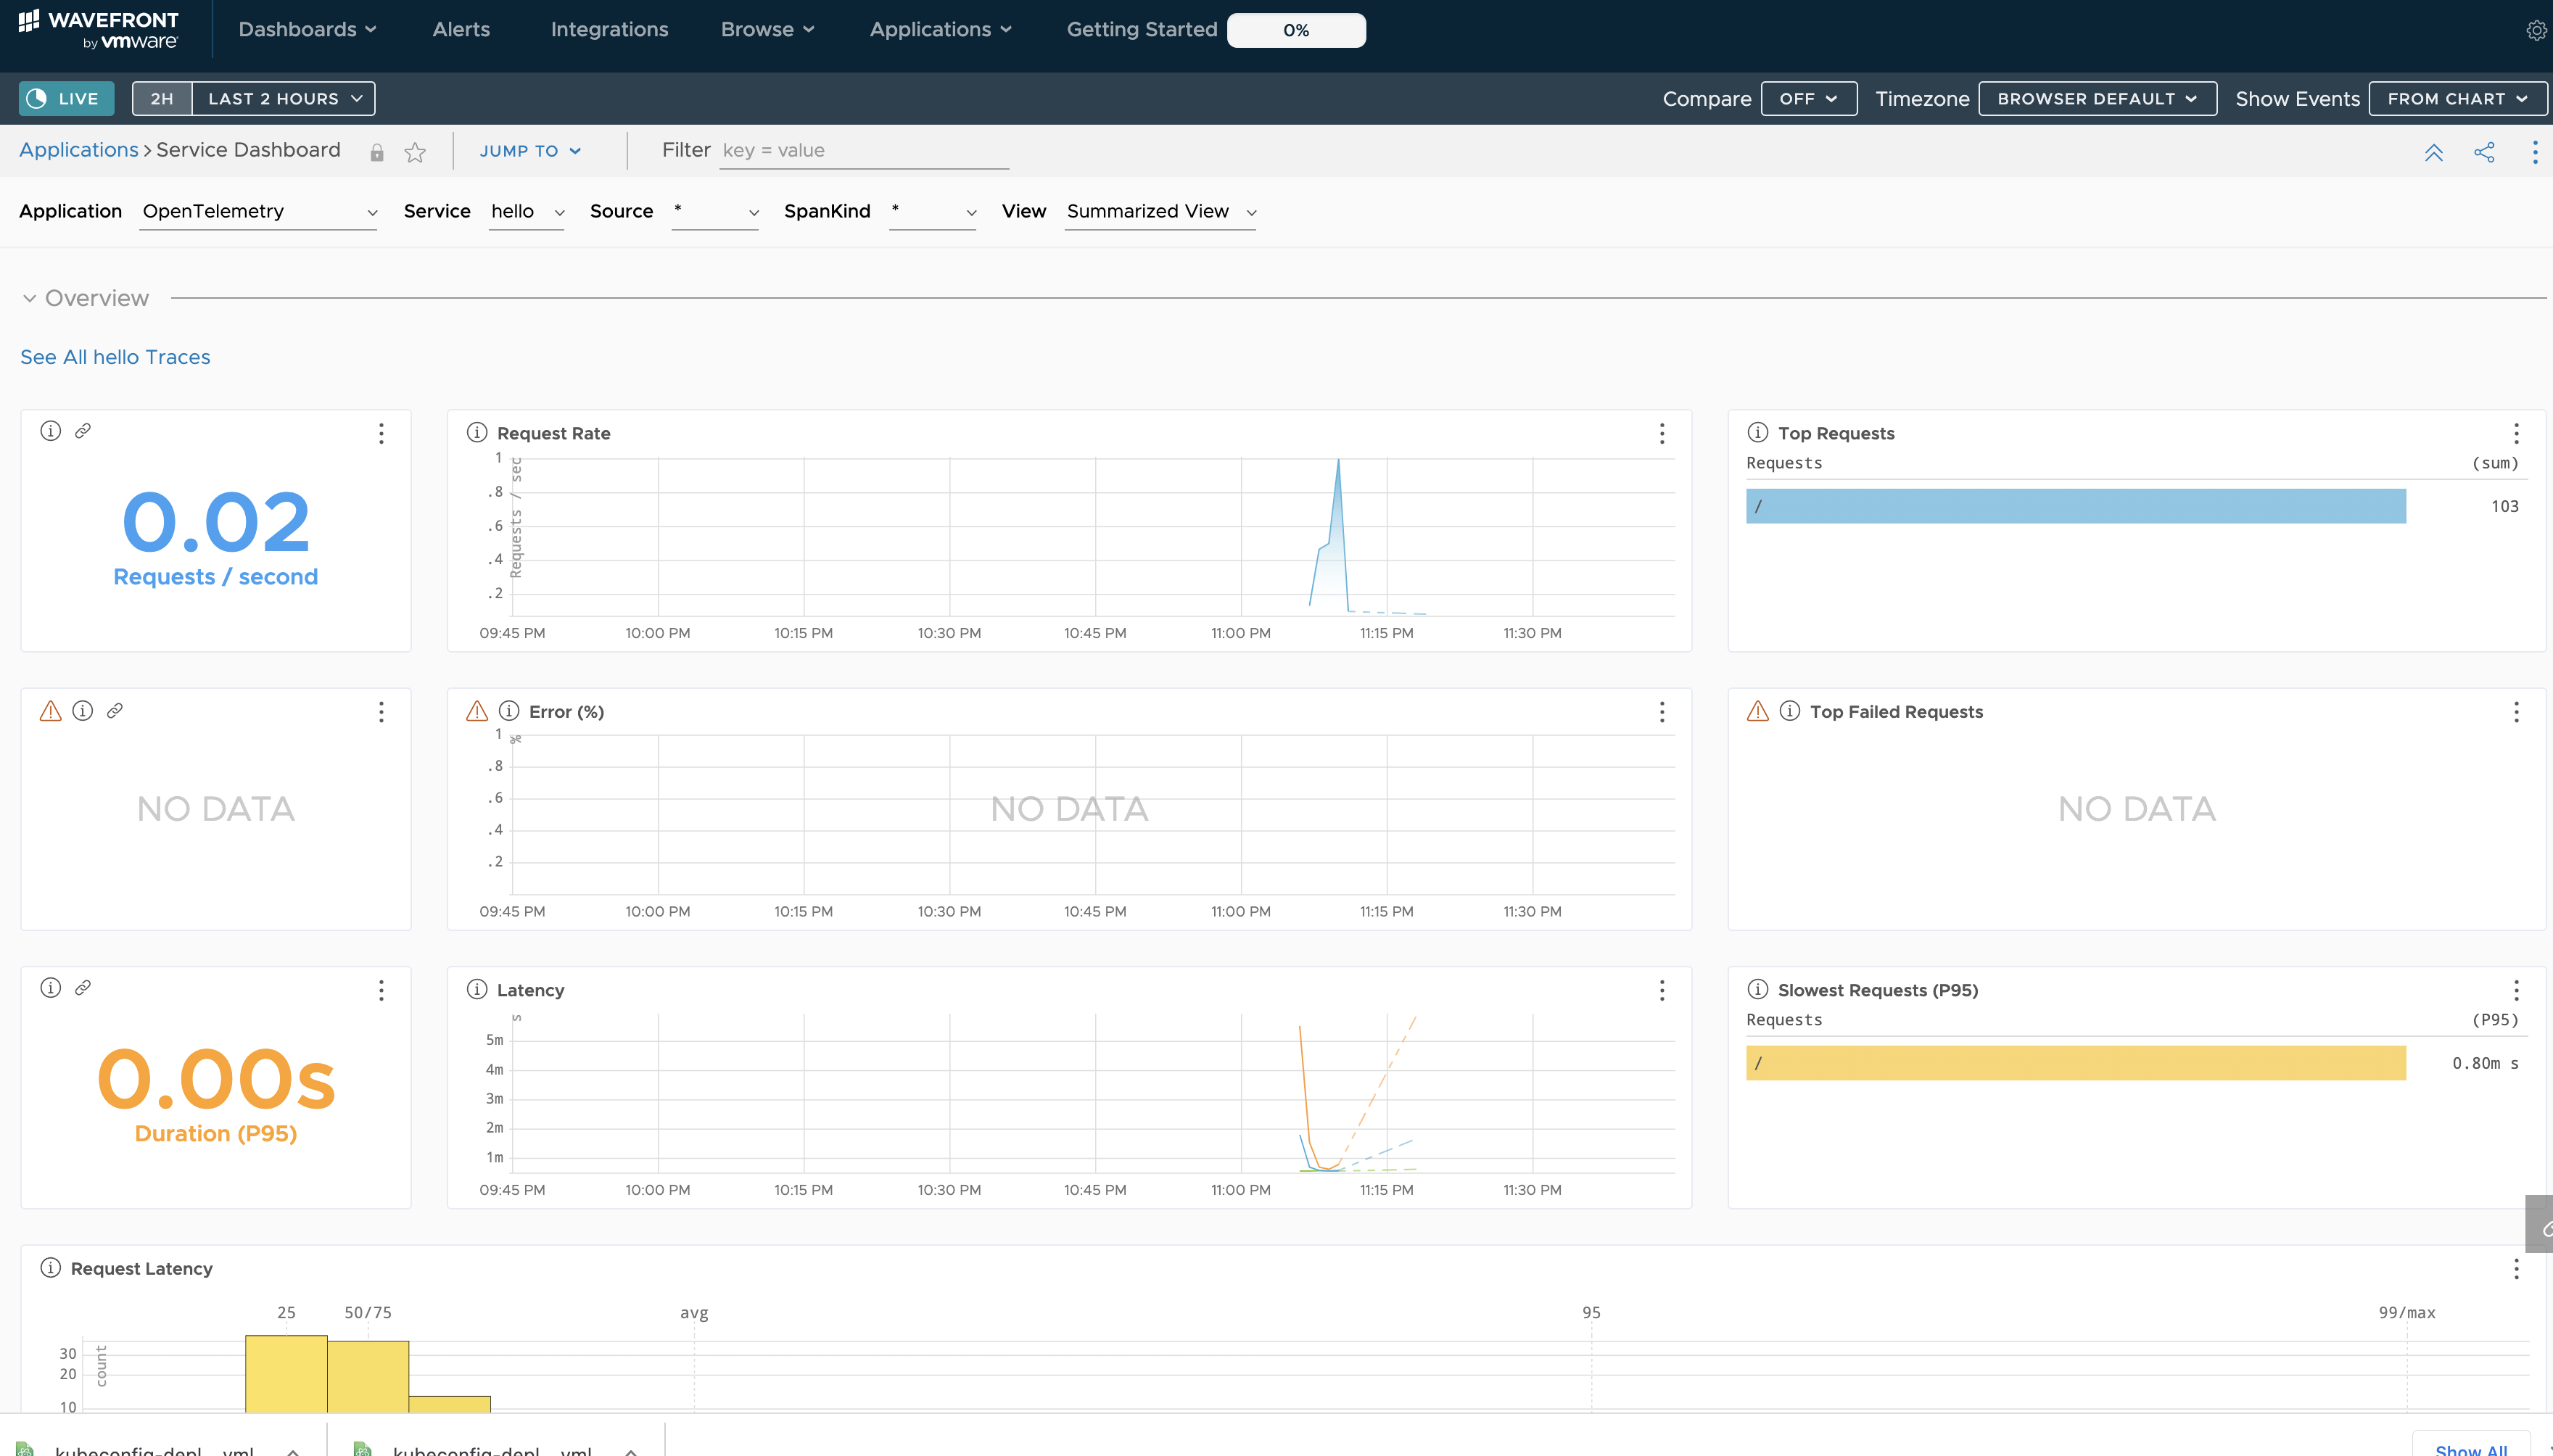
The dashboard looks like this:
And individual traces show up like this:
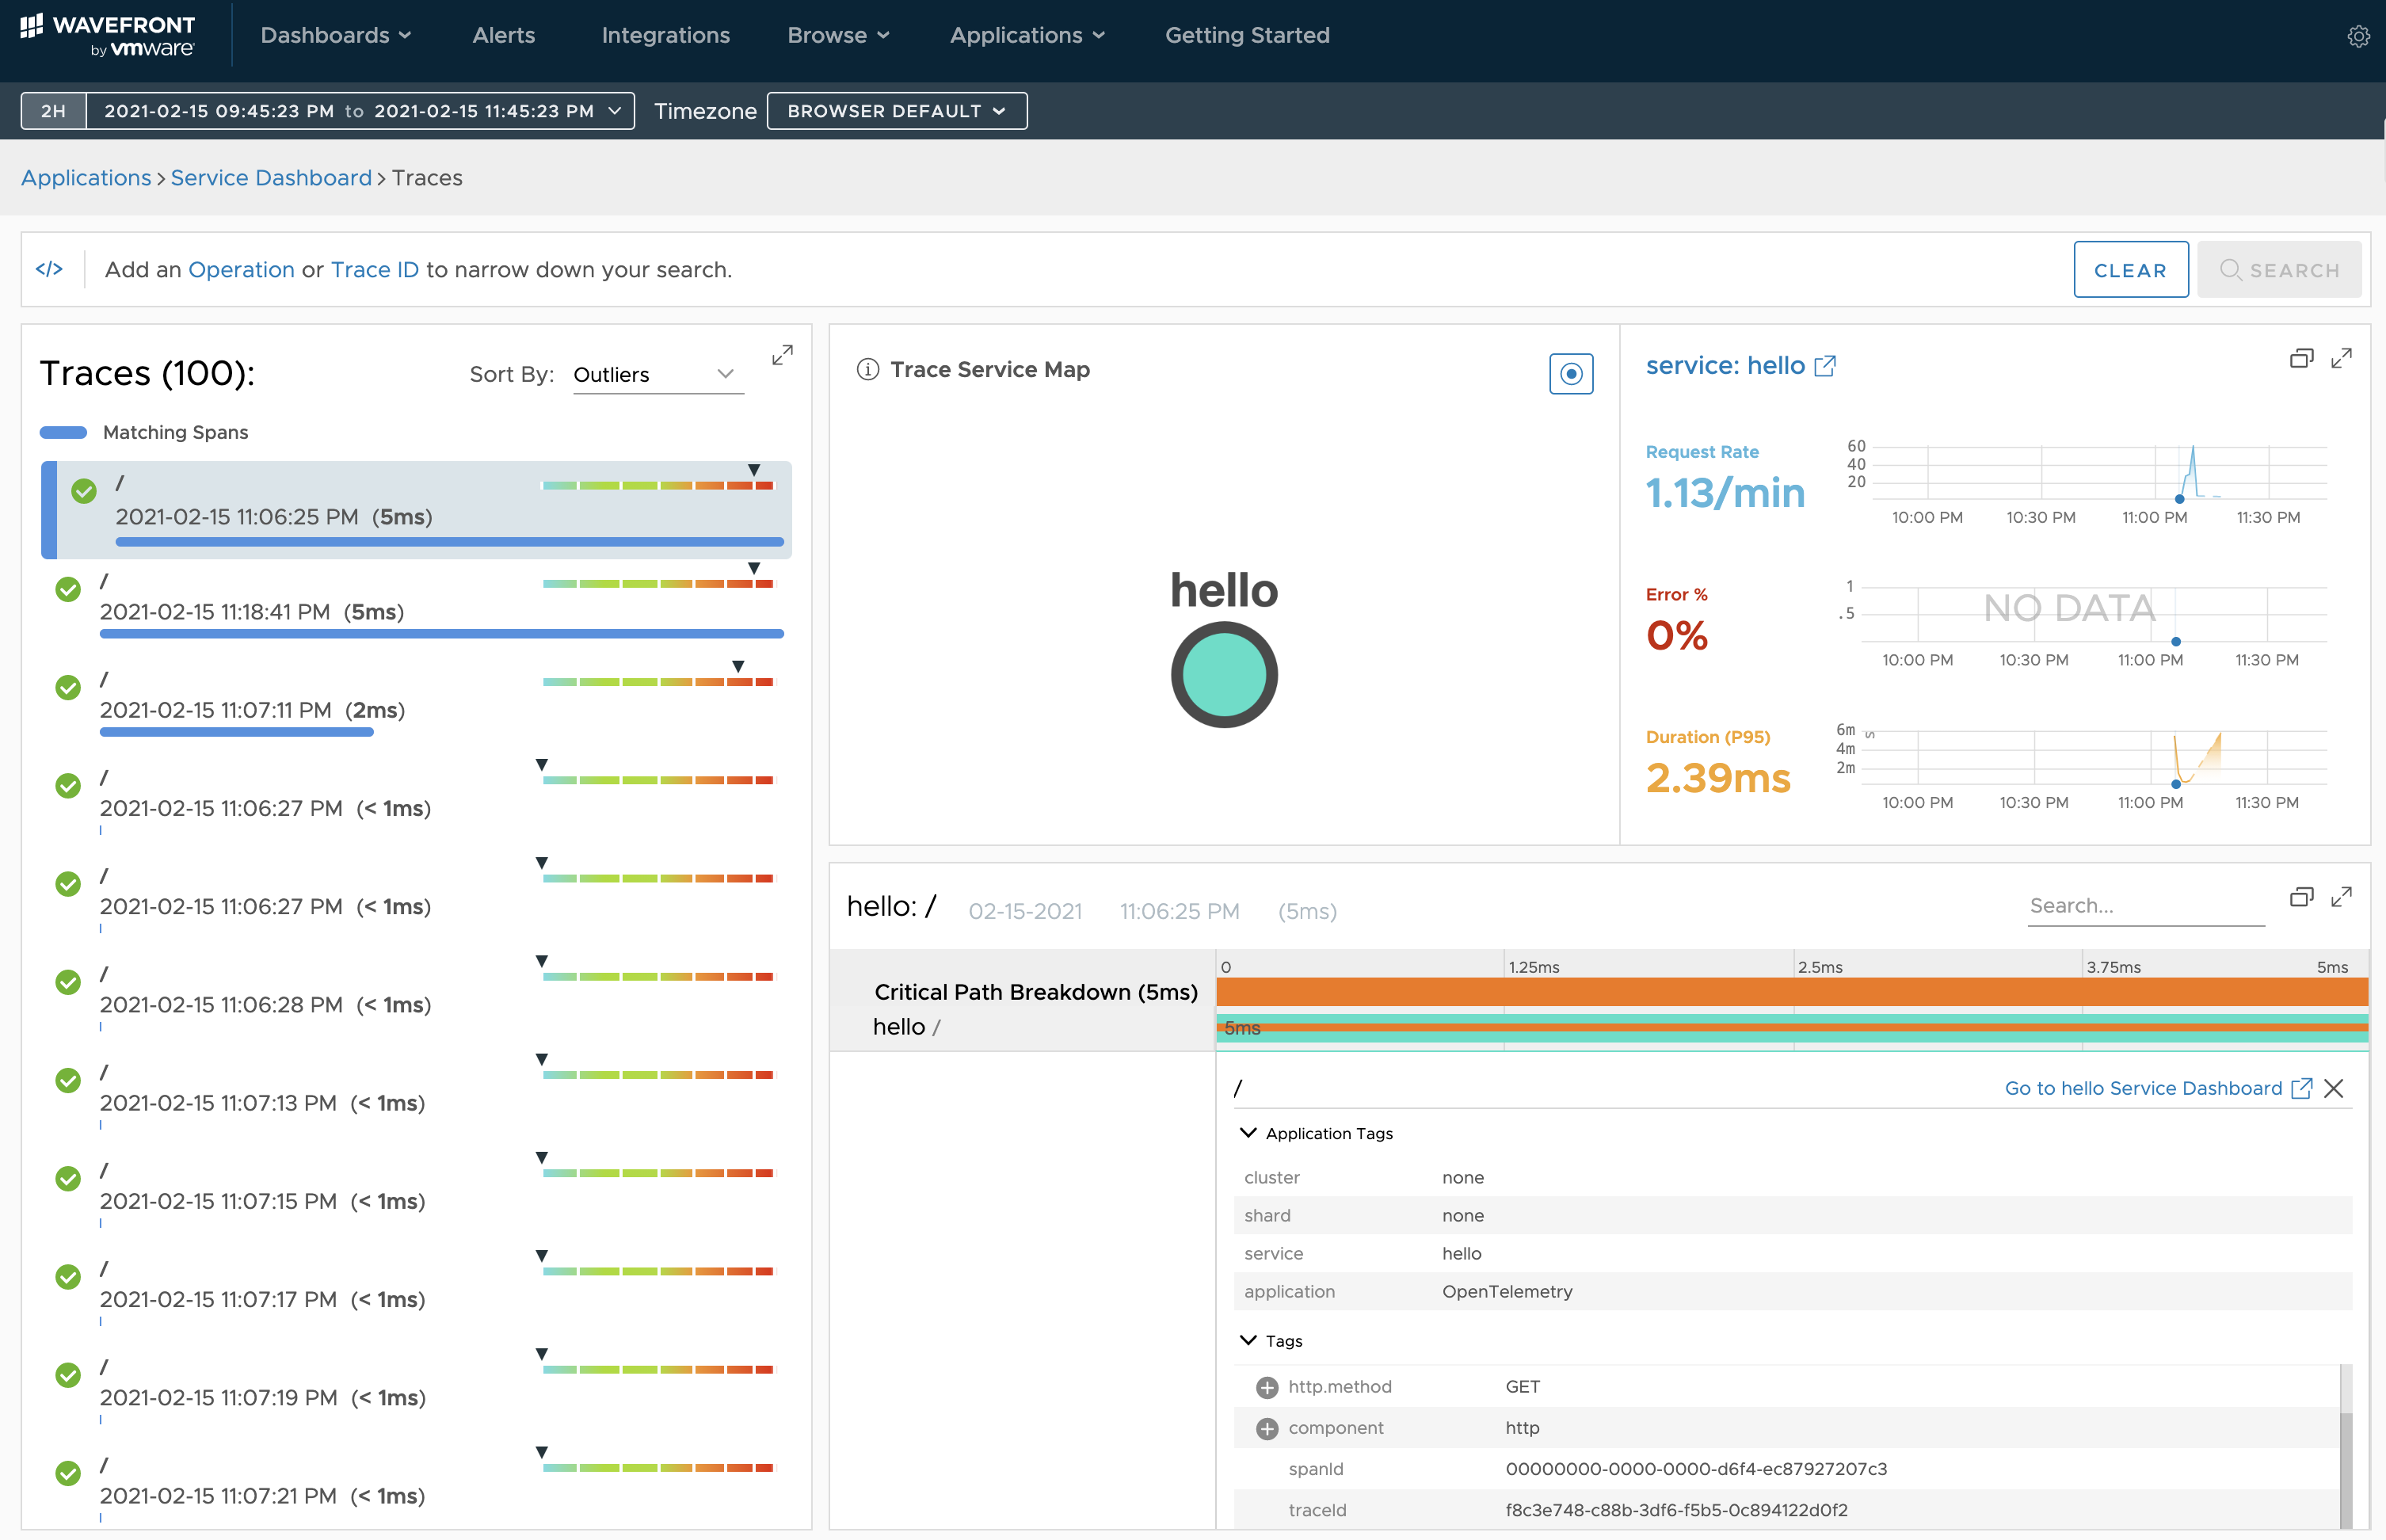
Wonderful. Again — this level of information was collected without adding any distributed tracing code on the Python side.
That said, OpenTelemetry is still an evolving project, so I don't recommend jumping in headfirst; using it for evaluation like this and then considering production use seems reasonable.
Summary
We introduced automatic distributed tracing with OpenTelemetry Auto Instrumentation, and showed that integrating with Wavefront is easy too.