Multi-Tenancy with Tanzu Observability + Metrics Security
· 6 min read
Metrics Security Policy enables multi-tenant setups in Tanzu Observability.
Introduction
Tanzu Observability is a SaaS platform, so all metrics are aggregated into one platform. As the number of users grows, the question becomes how to restrict what should and should not be visible. Tanzu Observability traditionally offered Roles and dashboard access restrictions. But once you granted access to a dashboard, preventing information that shouldn't be seen from slipping in was next to impossible.
To address this, a new feature called Metrics Security Policy was introduced. With it, the same dashboard shows different information depending on the user.
This is quite remarkable. Before this existed, you had to copy dashboards per user and fine-tune them... Now, with a single dashboard and a metrics policy, you get multi-tenancy. Incidentally, this feature is reportedly patent-pending and unique to Tanzu Observability.
Let's put it to the test.
Prerequisites
Using this feature requires a Trial Account or above. Sign up if you're interested.
Verification
Let's verify quickly.
Example with no policy at all
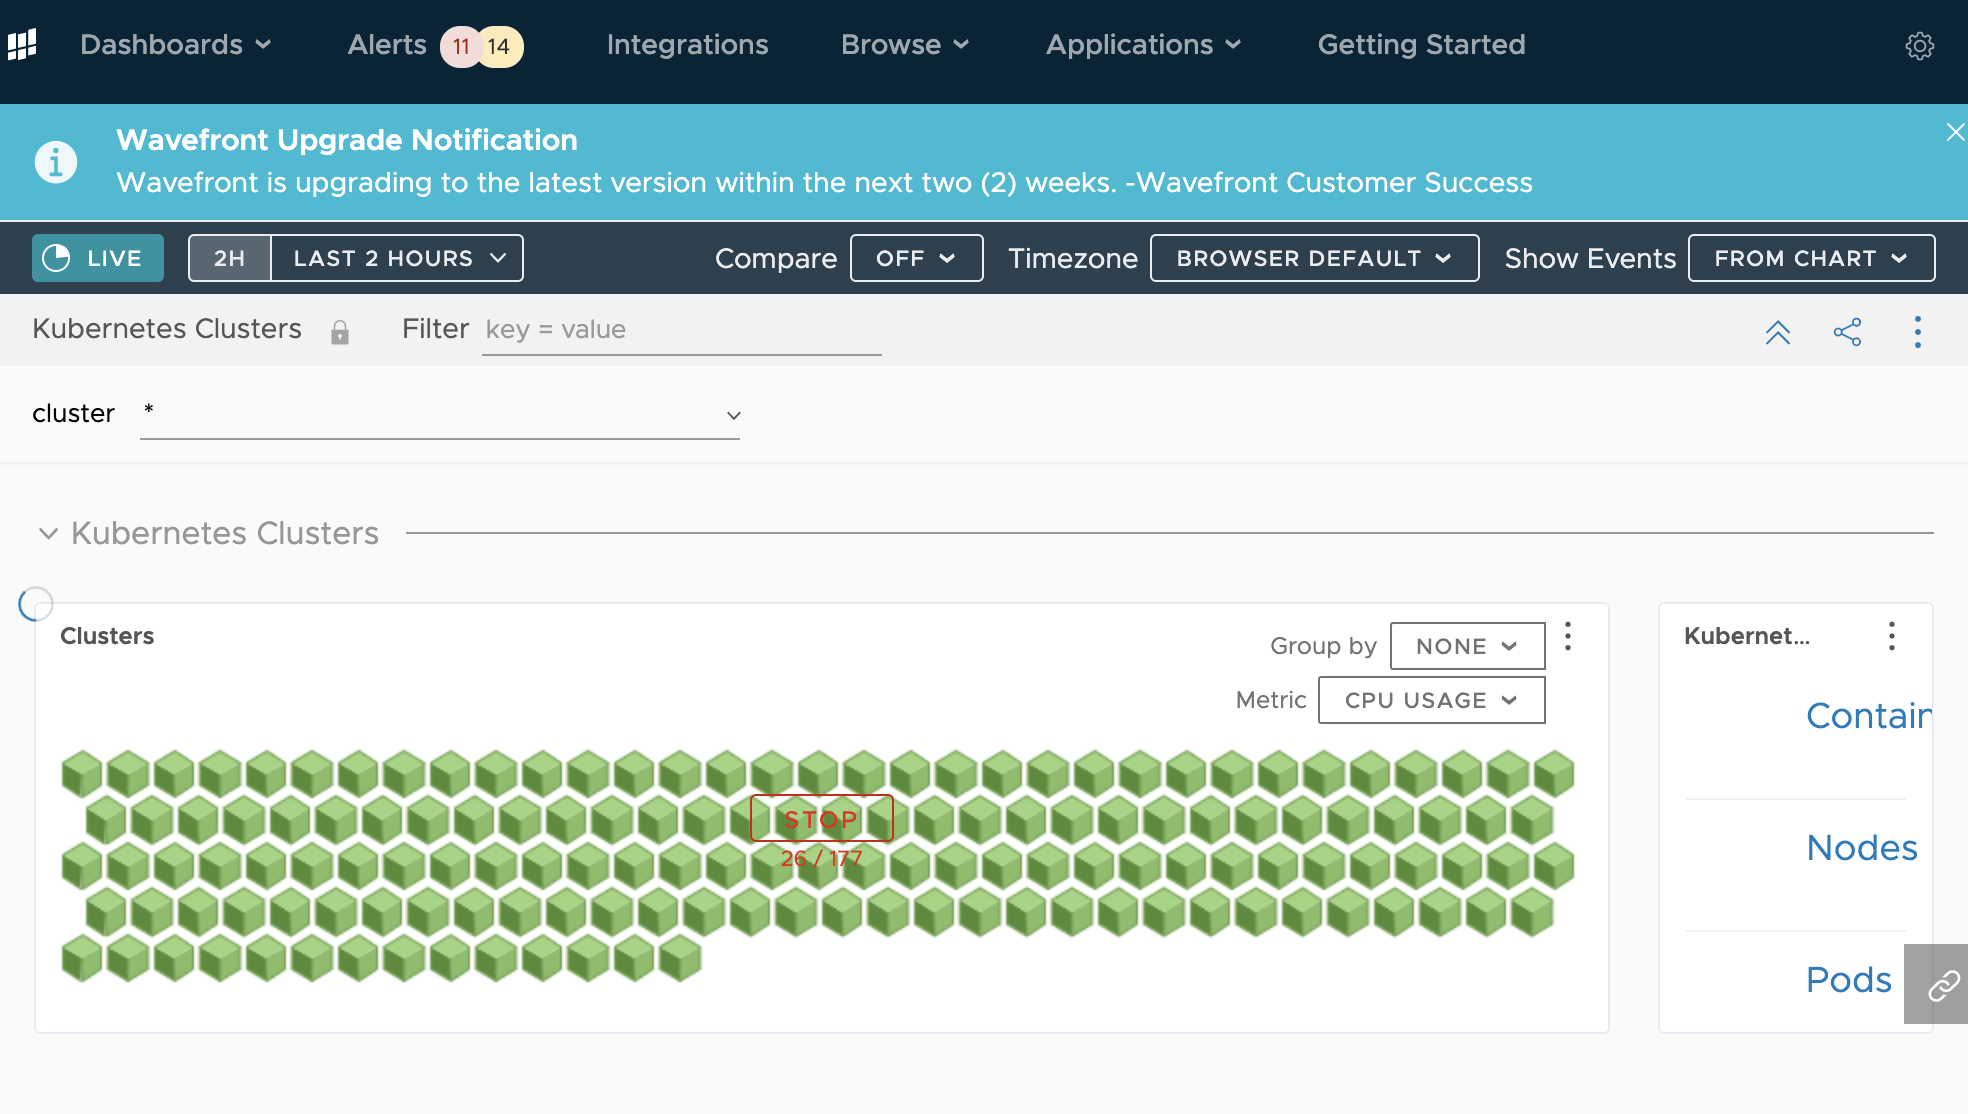
First, here is an example with no security policy applied. This tenant is used freely by many people, so more than 100 Kubernetes clusters show up.
Hide everything with a policy
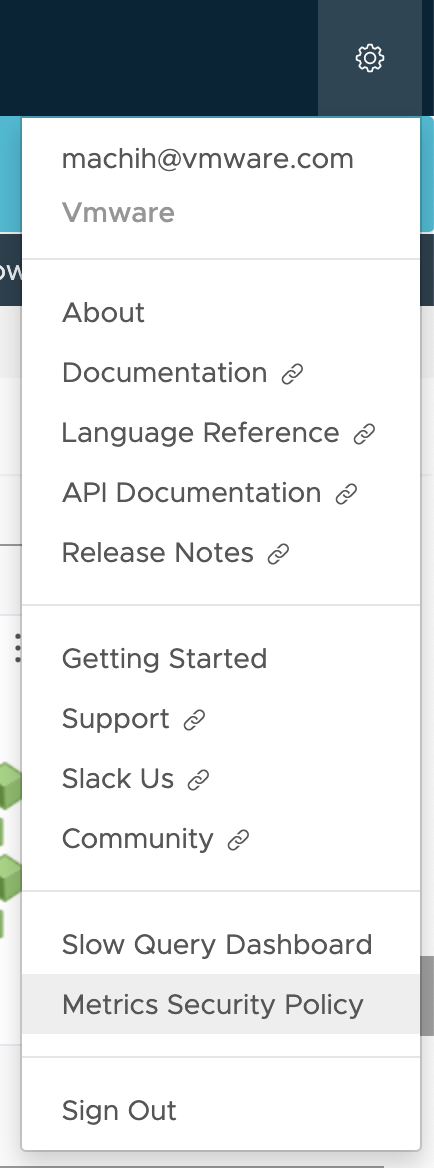
Let's first make everything invisible. Configure MetricsSecurityPolicy from the diamond icon on the right.
Then configure it like this:
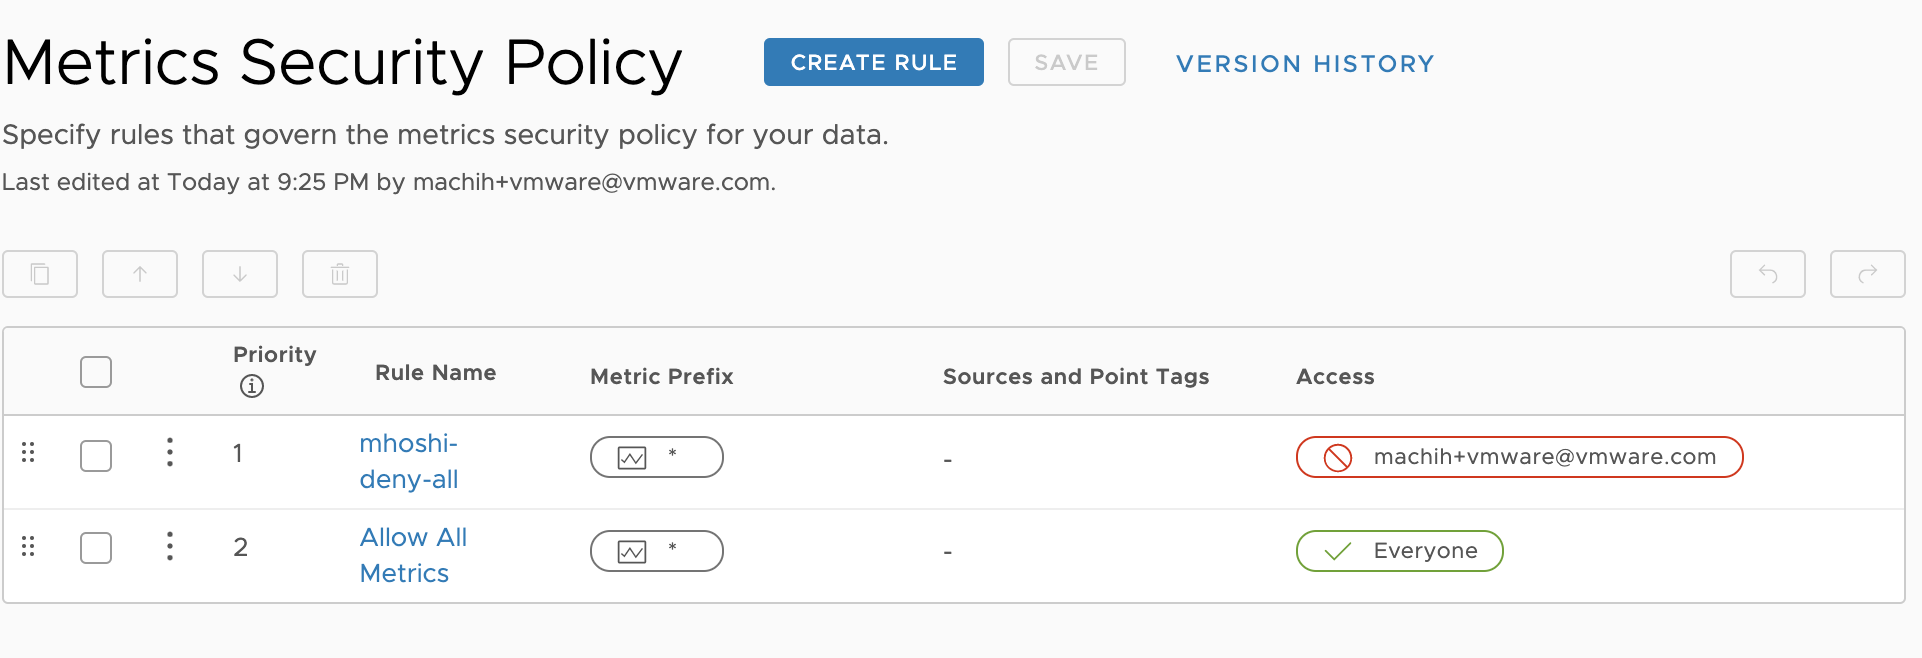
This applies the following rules:
- machi@vmware.com is blocked from accessing all metrics
- All other users can continue to access all metrics
Now open the Kubernetes dashboard again. It shows "All metrics in this chart are excluded due to metrics security policy rules." and nothing is visible.
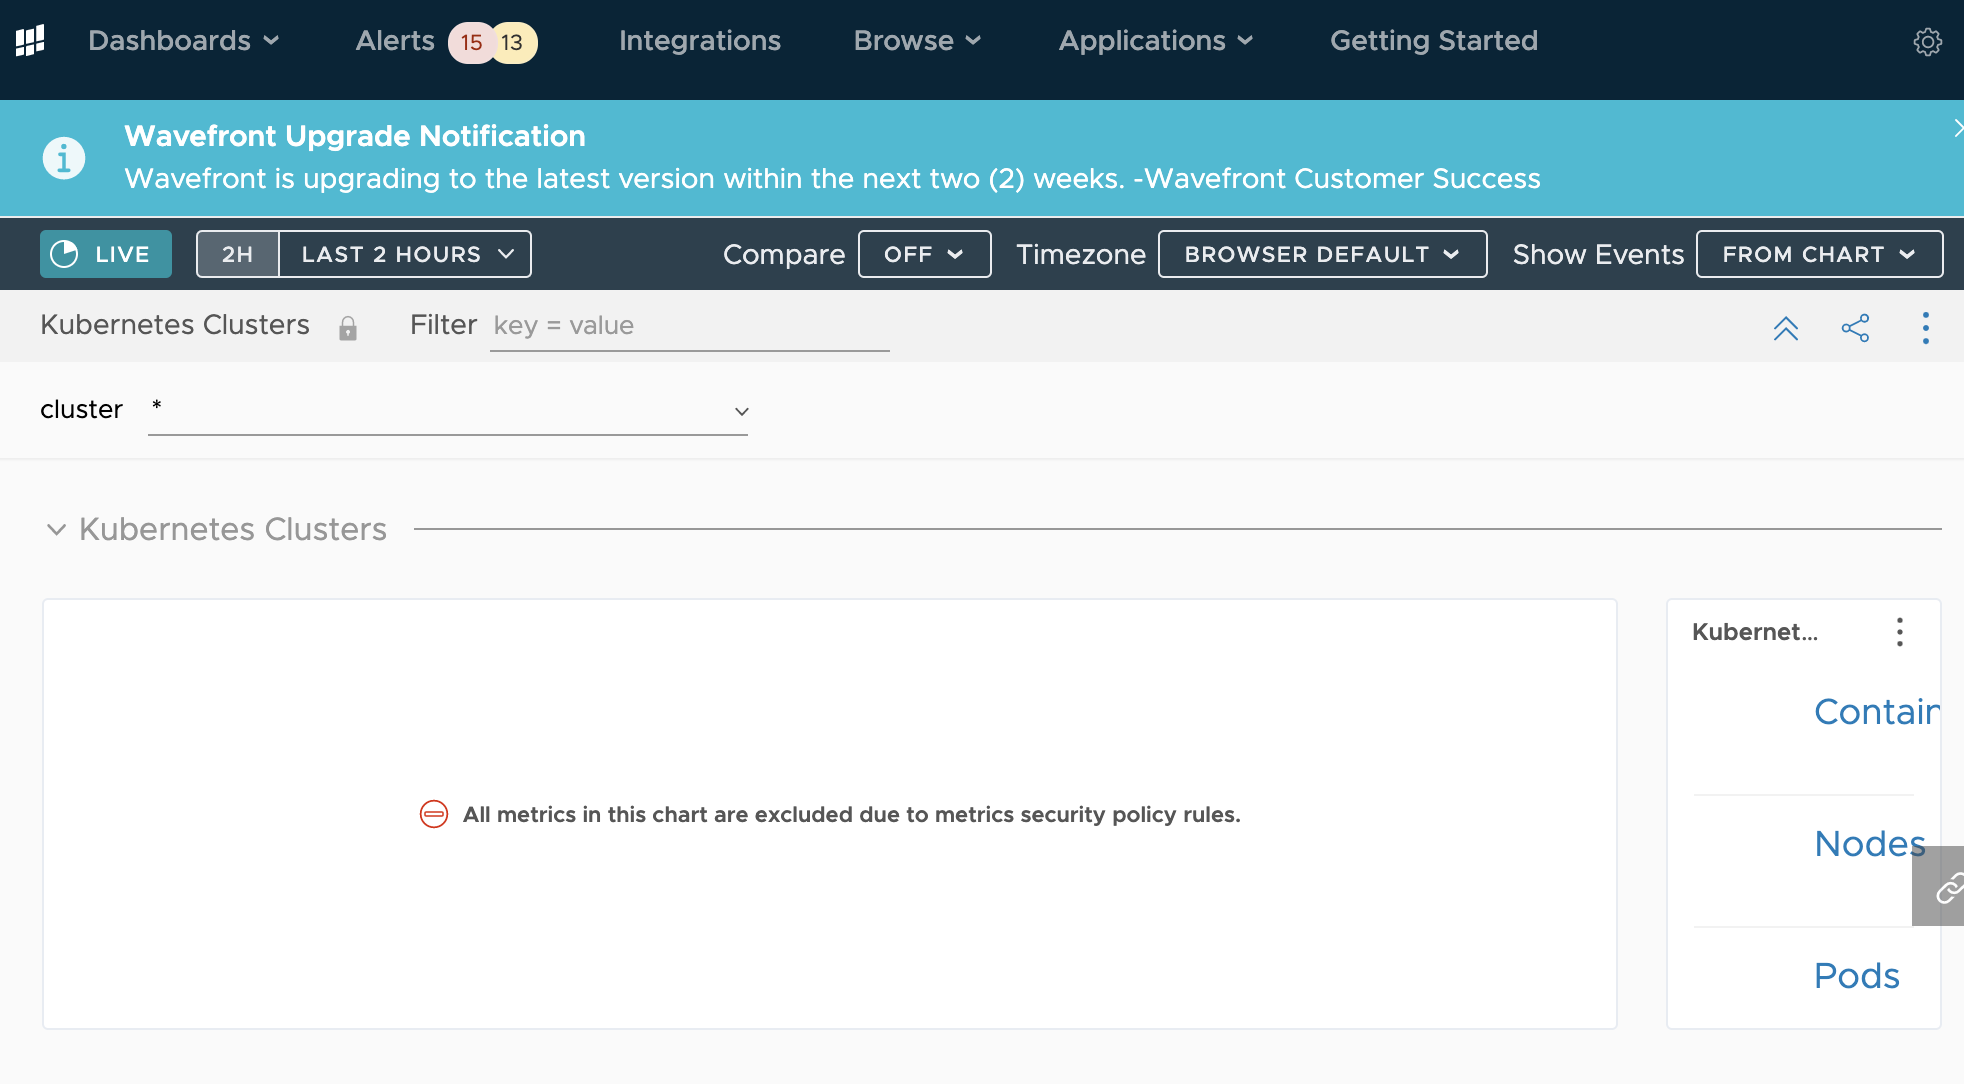
So far so good.
Show only my own Kubernetes cluster
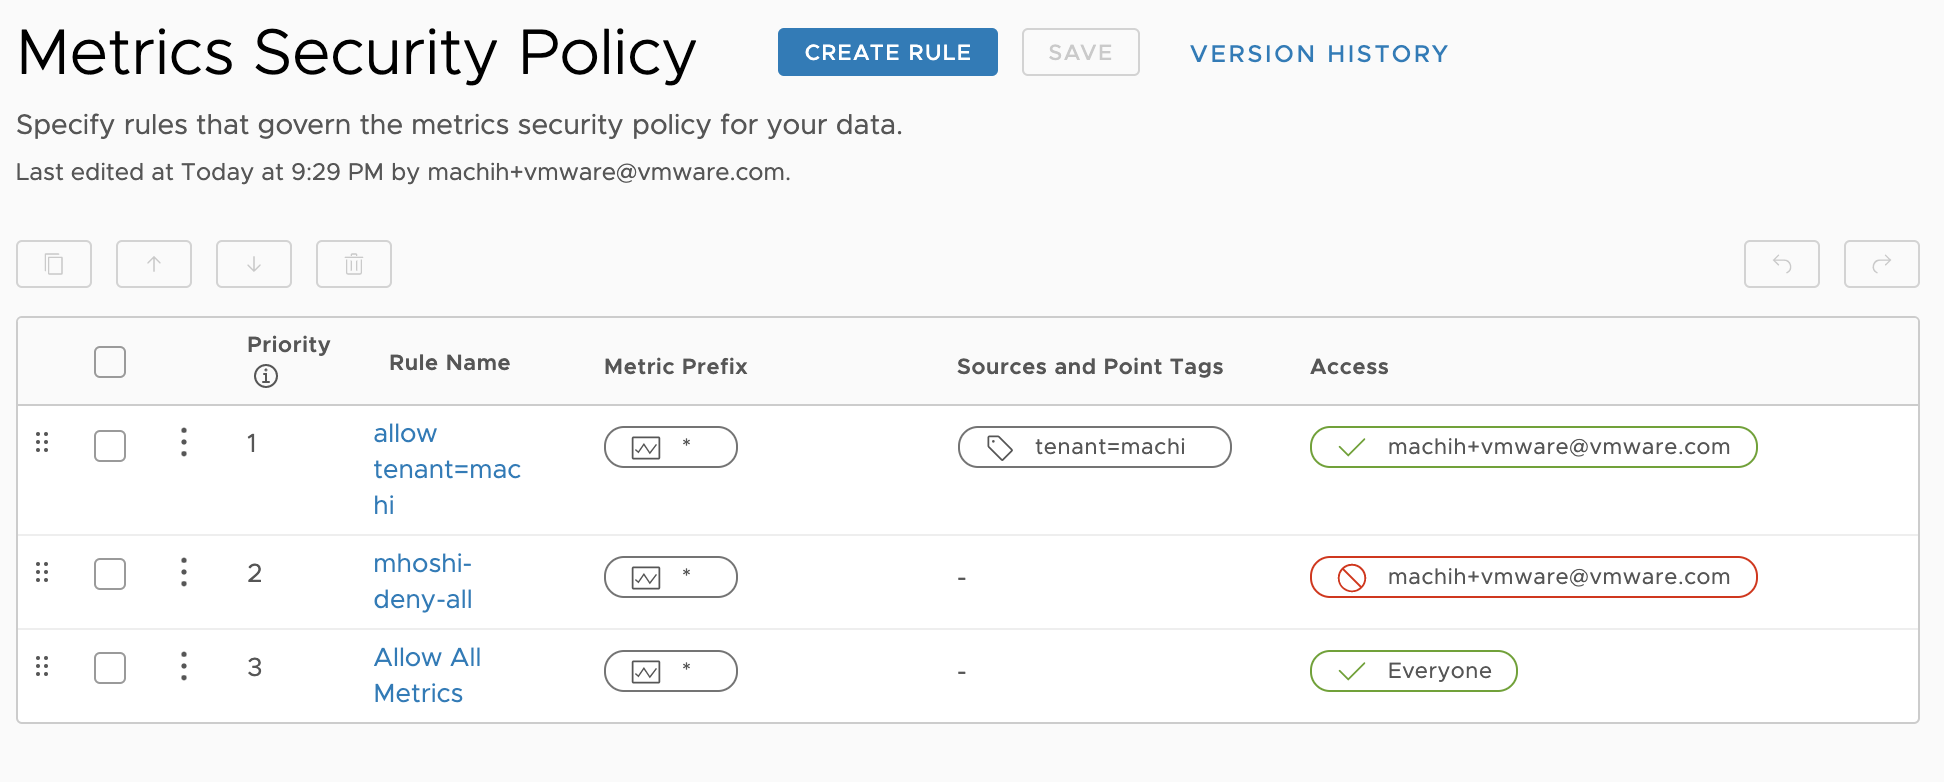
Next, configure it like this:
The first rule is the interesting one: it shows metrics only when Source and Point Tags has tenant=machi. (How to add this tag to metrics is described below.)
Open the dashboard once more in this state.
The 100+ clusters are now reduced to just my own cluster.
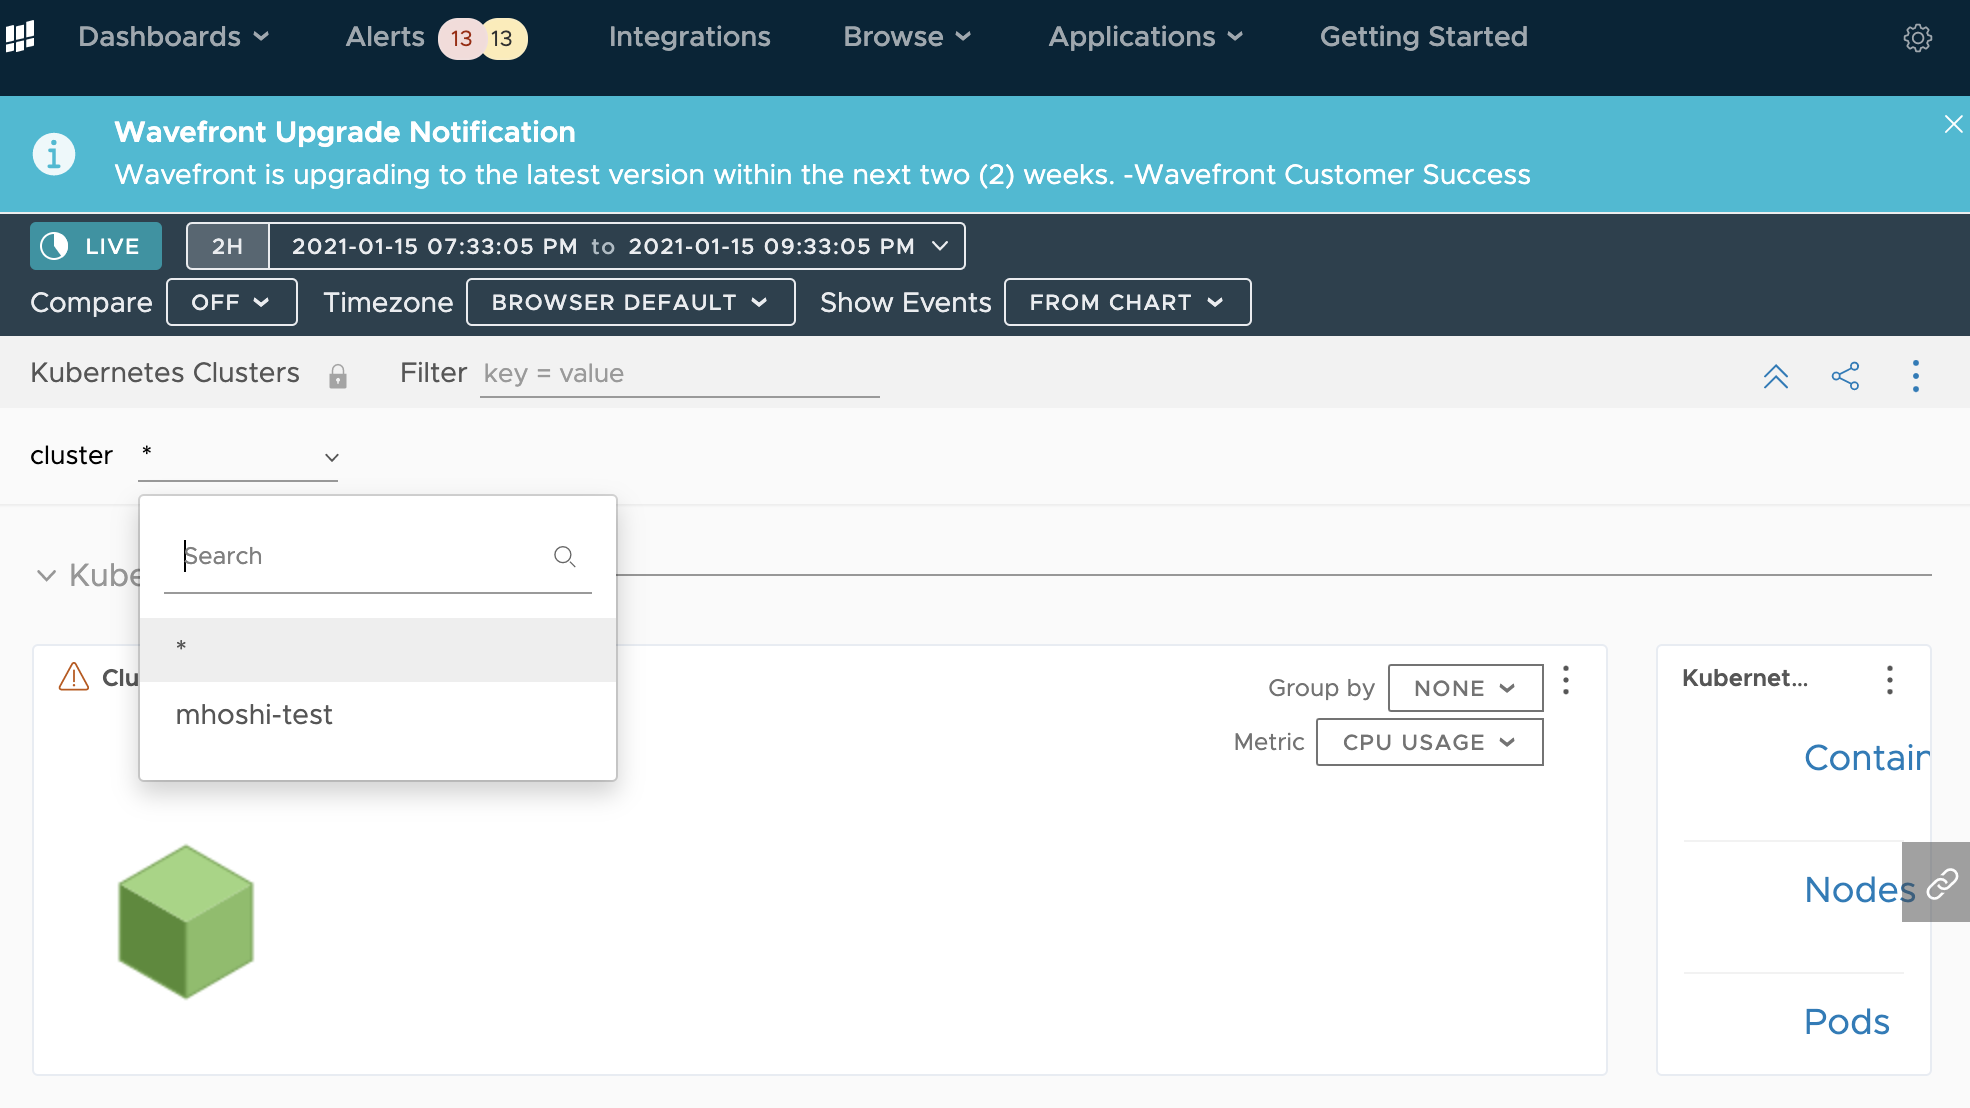
Amazing. We confirmed that the same dashboard can control what is visible this way.
How do you add the tag?
So how was the tenant=machi tag added? Using wavefront proxy preprocessor rules.
With this, every metric passing through the Proxy gets a tag attached before being sent to Tanzu Observability.
For this test I used the Wavefront Collector Helm chart.
Prepare a helm.yaml file like this:
clusterName: mhoshi-test

wavefront:
  url: https://xxx.wavefront.com
  token: xxxxxxxxxxxxxxxxxx
proxy:
  preprocessor:
    rules.yaml: |
      '2878':
       - rule    : tag-all-metrics
         action  : addTag
         tag     : tenant
         value   : "machi"
       - rule    : tag-all-metrics
         action  : addTagIfNotExists
         tag     : tenant
         value   : "machi"
Then deploy helm to the Kubernetes environment like below and you're done:
kubectl create namespace wavefront
helm install -f helm.yaml wavefront wavefront/wavefront --namespace wavefront
Summary
Metrics Security Policy makes multi-tenant setups in Tanzu Observability much easier.