Monitoring TMC Policy Violations from Tanzu Observability
· 5 min read
The policy violation information reported by Tanzu Mission Control (TMC) works on top of the Open Policy Agent mechanism. And it can be monitored from Tanzu Observability (TO).
Introduction
As covered in this series, OPA is the mechanism behind TMC's policy management.
This time we look at the Policy Insights feature:
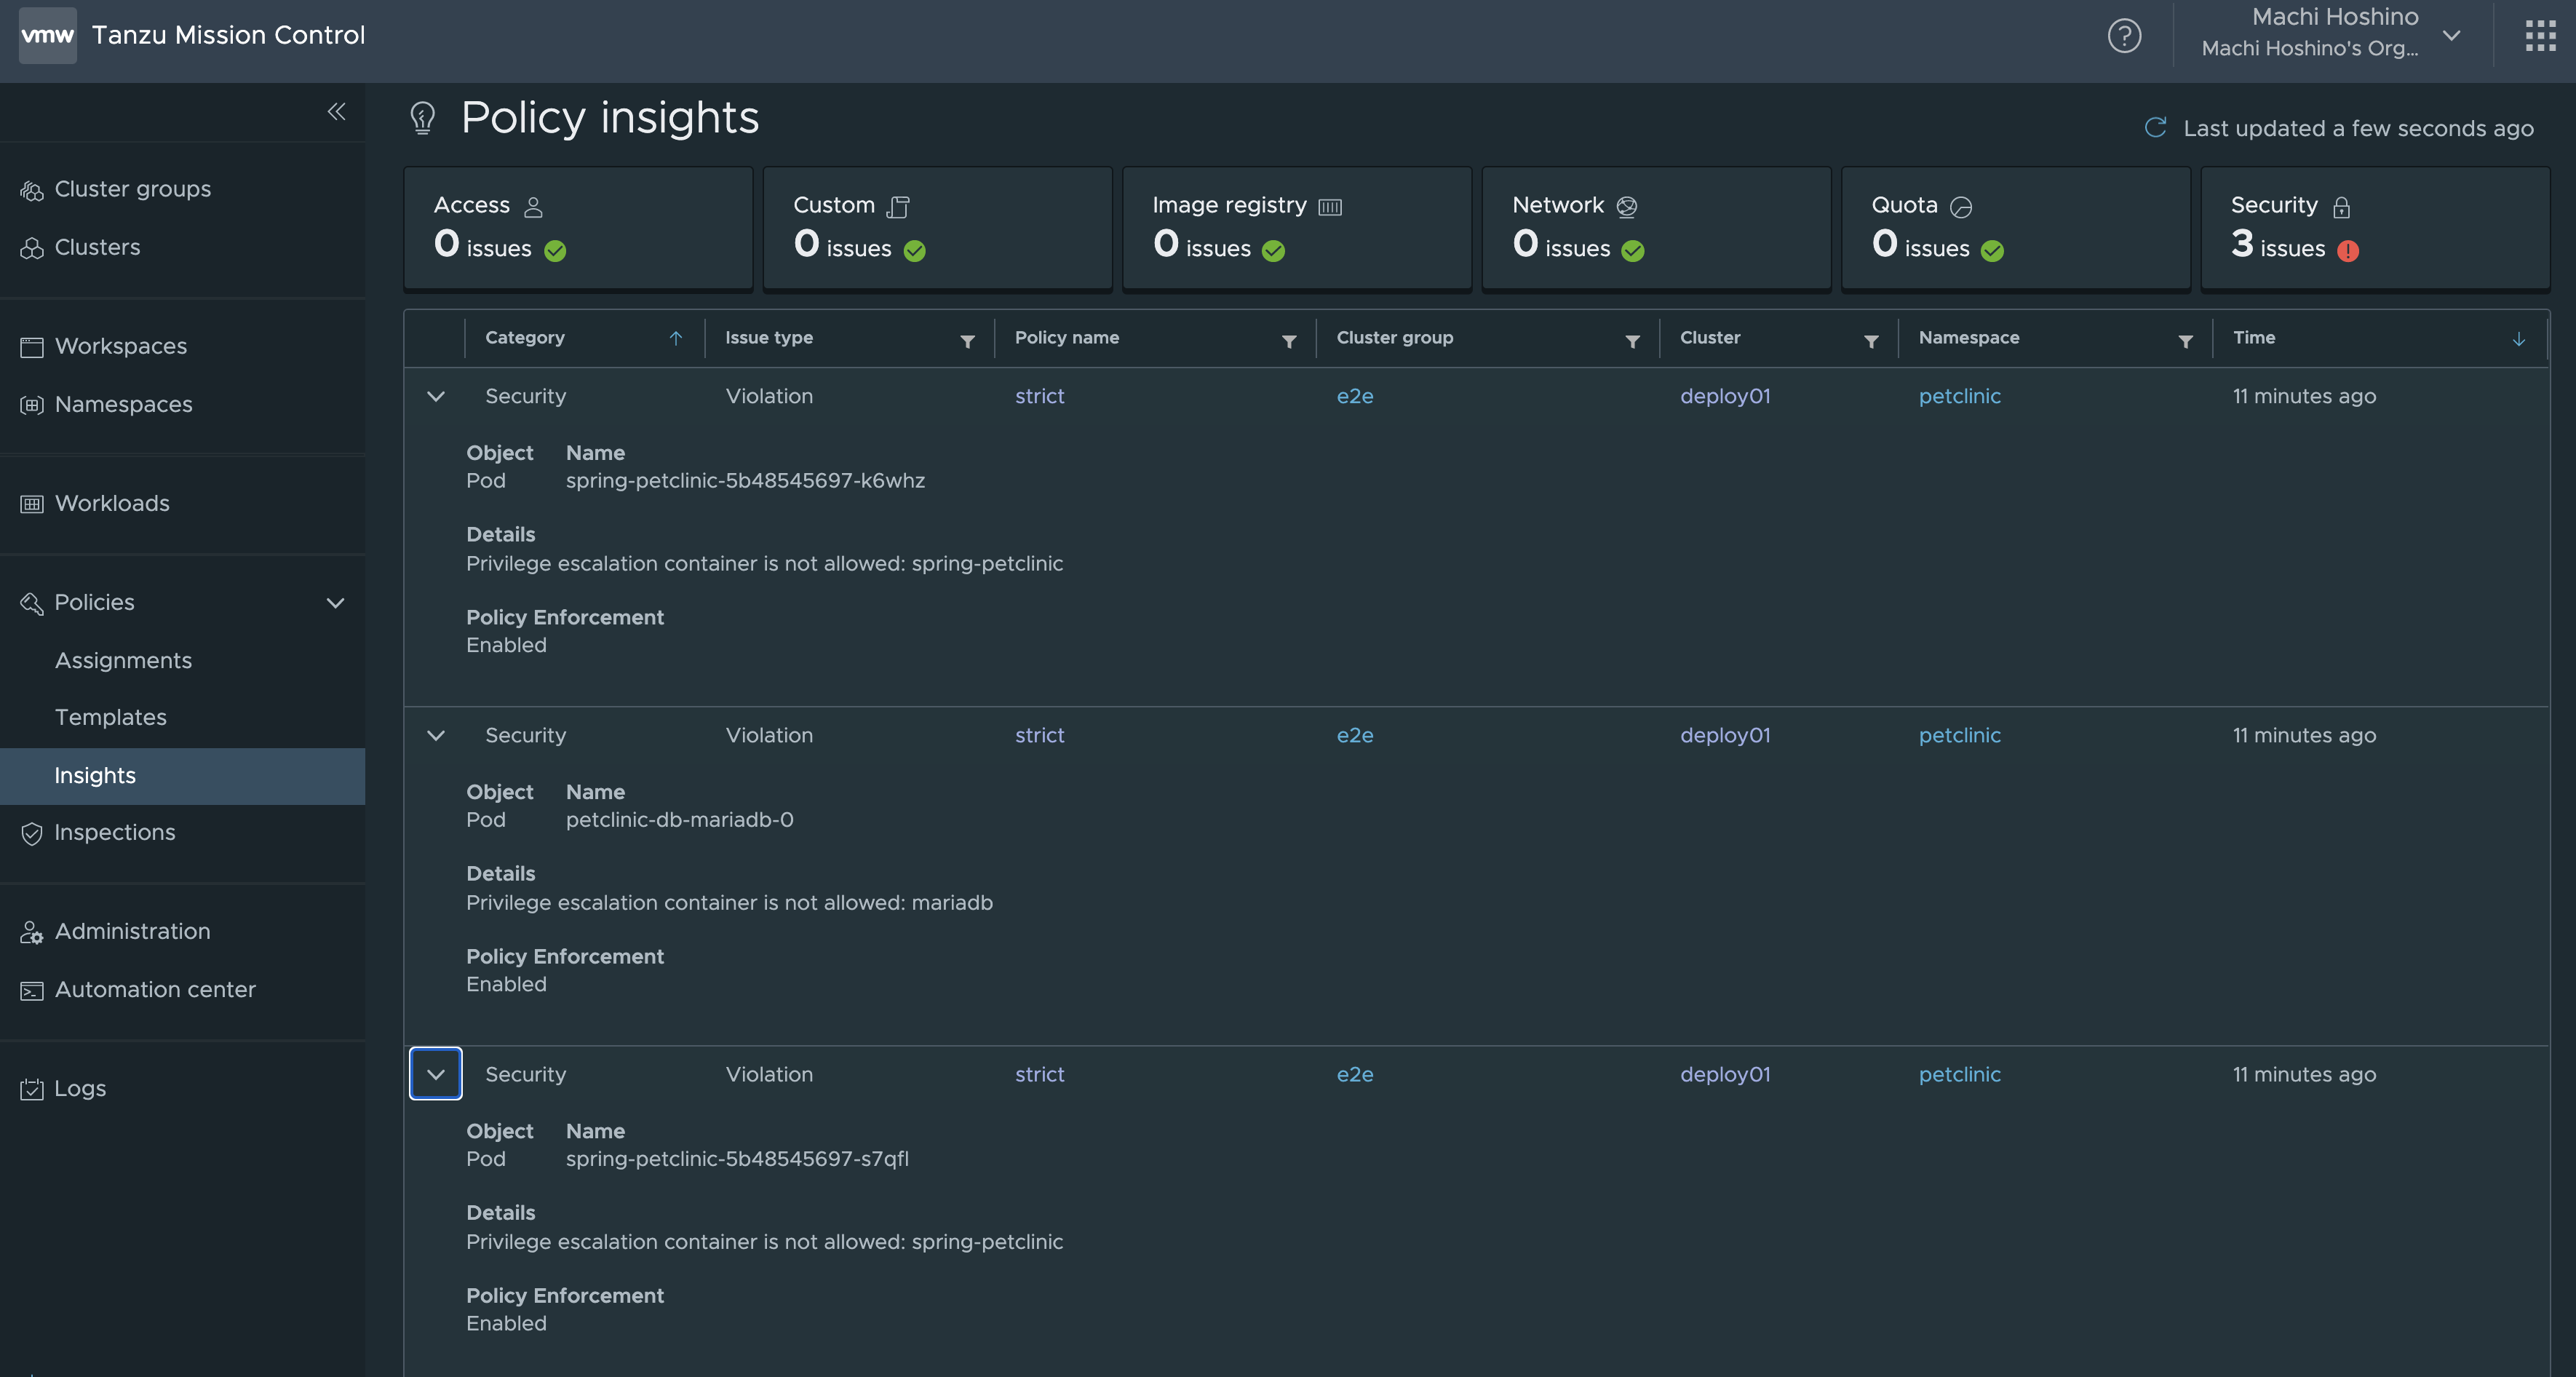
As introduced in Playing with TMC's Open Policy Agent, these are the violation values reported by Open Policy Agent (OPA). Now, TMC has no alerting feature so far. So while this Policy Insights information is useful, it isn't being monitored. When it comes to alerting and monitoring, that's Tanzu Observability. OPA defines metrics by default, so this time let's wire those up to TO.
Prerequisites
- You have Kubernetes
- You have a TMC account (if not, use the HOL)
- You have a TO account (if not, sign up for the Free Trial)
Steps
1. Register Kubernetes with TMC
How to do this is shared in the HOL and elsewhere, so I'll skip it.
2. Enable TMC policies on Kubernetes
Explained in Playing with TMC's Open Policy Agent, so I'll skip it.
3. Configure Tanzu Observability
With TMC, configuring TO is easy. Select the target cluster, then choose [Actions] > [Integrations] > [Tanzu Observability by Wavefront].
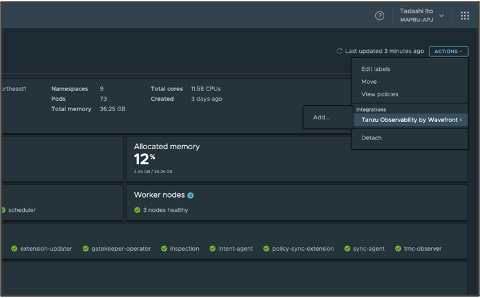
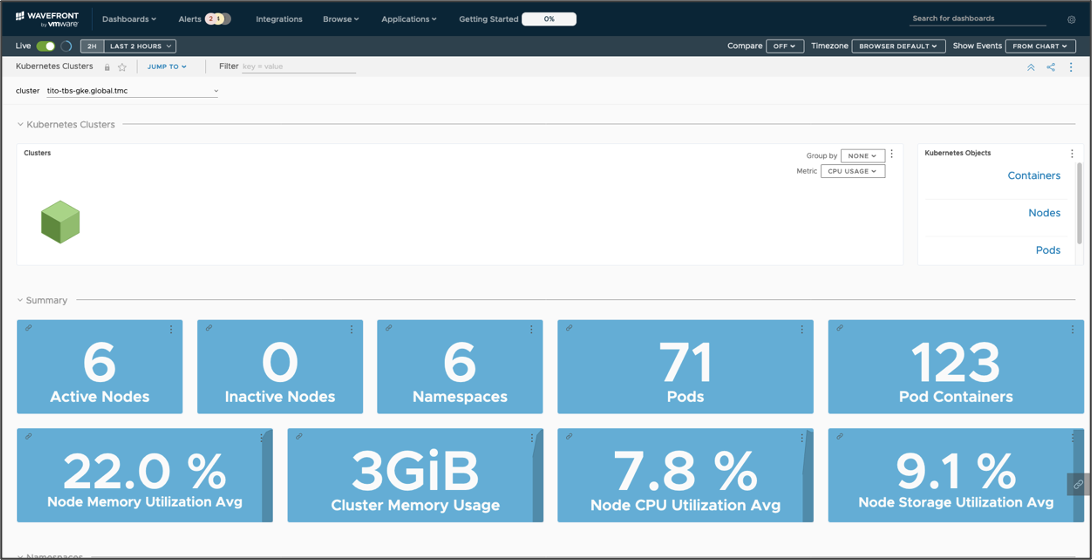
Enter your TO account information, run it, and wait a while. TO will then naturally start showing this:
4. Create the OPA discovery file
When TO is configured from TMC, a feature called Runtime Config is enabled by default.
This lets you define additional scrape targets via a ConfigMap. Prepare a file like the following. It finds OPA-related pods and scrapes port 8888.
apiVersion: v1
kind: ConfigMap
metadata:
  name: opa-collector
  namespace: tanzu-observability-saas
  annotations:
    # This annotation is required for runtime configurations
    wavefront.com/discovery-config: 'true'
data:
  collector.yaml: |
    # specify a list of discovery rules (plugins)
    plugins:
    # memcached
    - name: opa
      type: prometheus
      selectors:
        labels:
          gatekeeper.sh/system:
          - yes
      port: 8888
5. Apply it
Then it's just a kubectl apply:
kubectl apply -f <file from step 4>
That's it.
Taking a look
Log into the TO screen. From [Browse] > [Metrics], select the path below.
Then look at "gatekeeper.violations.gauge". It shows up like this:
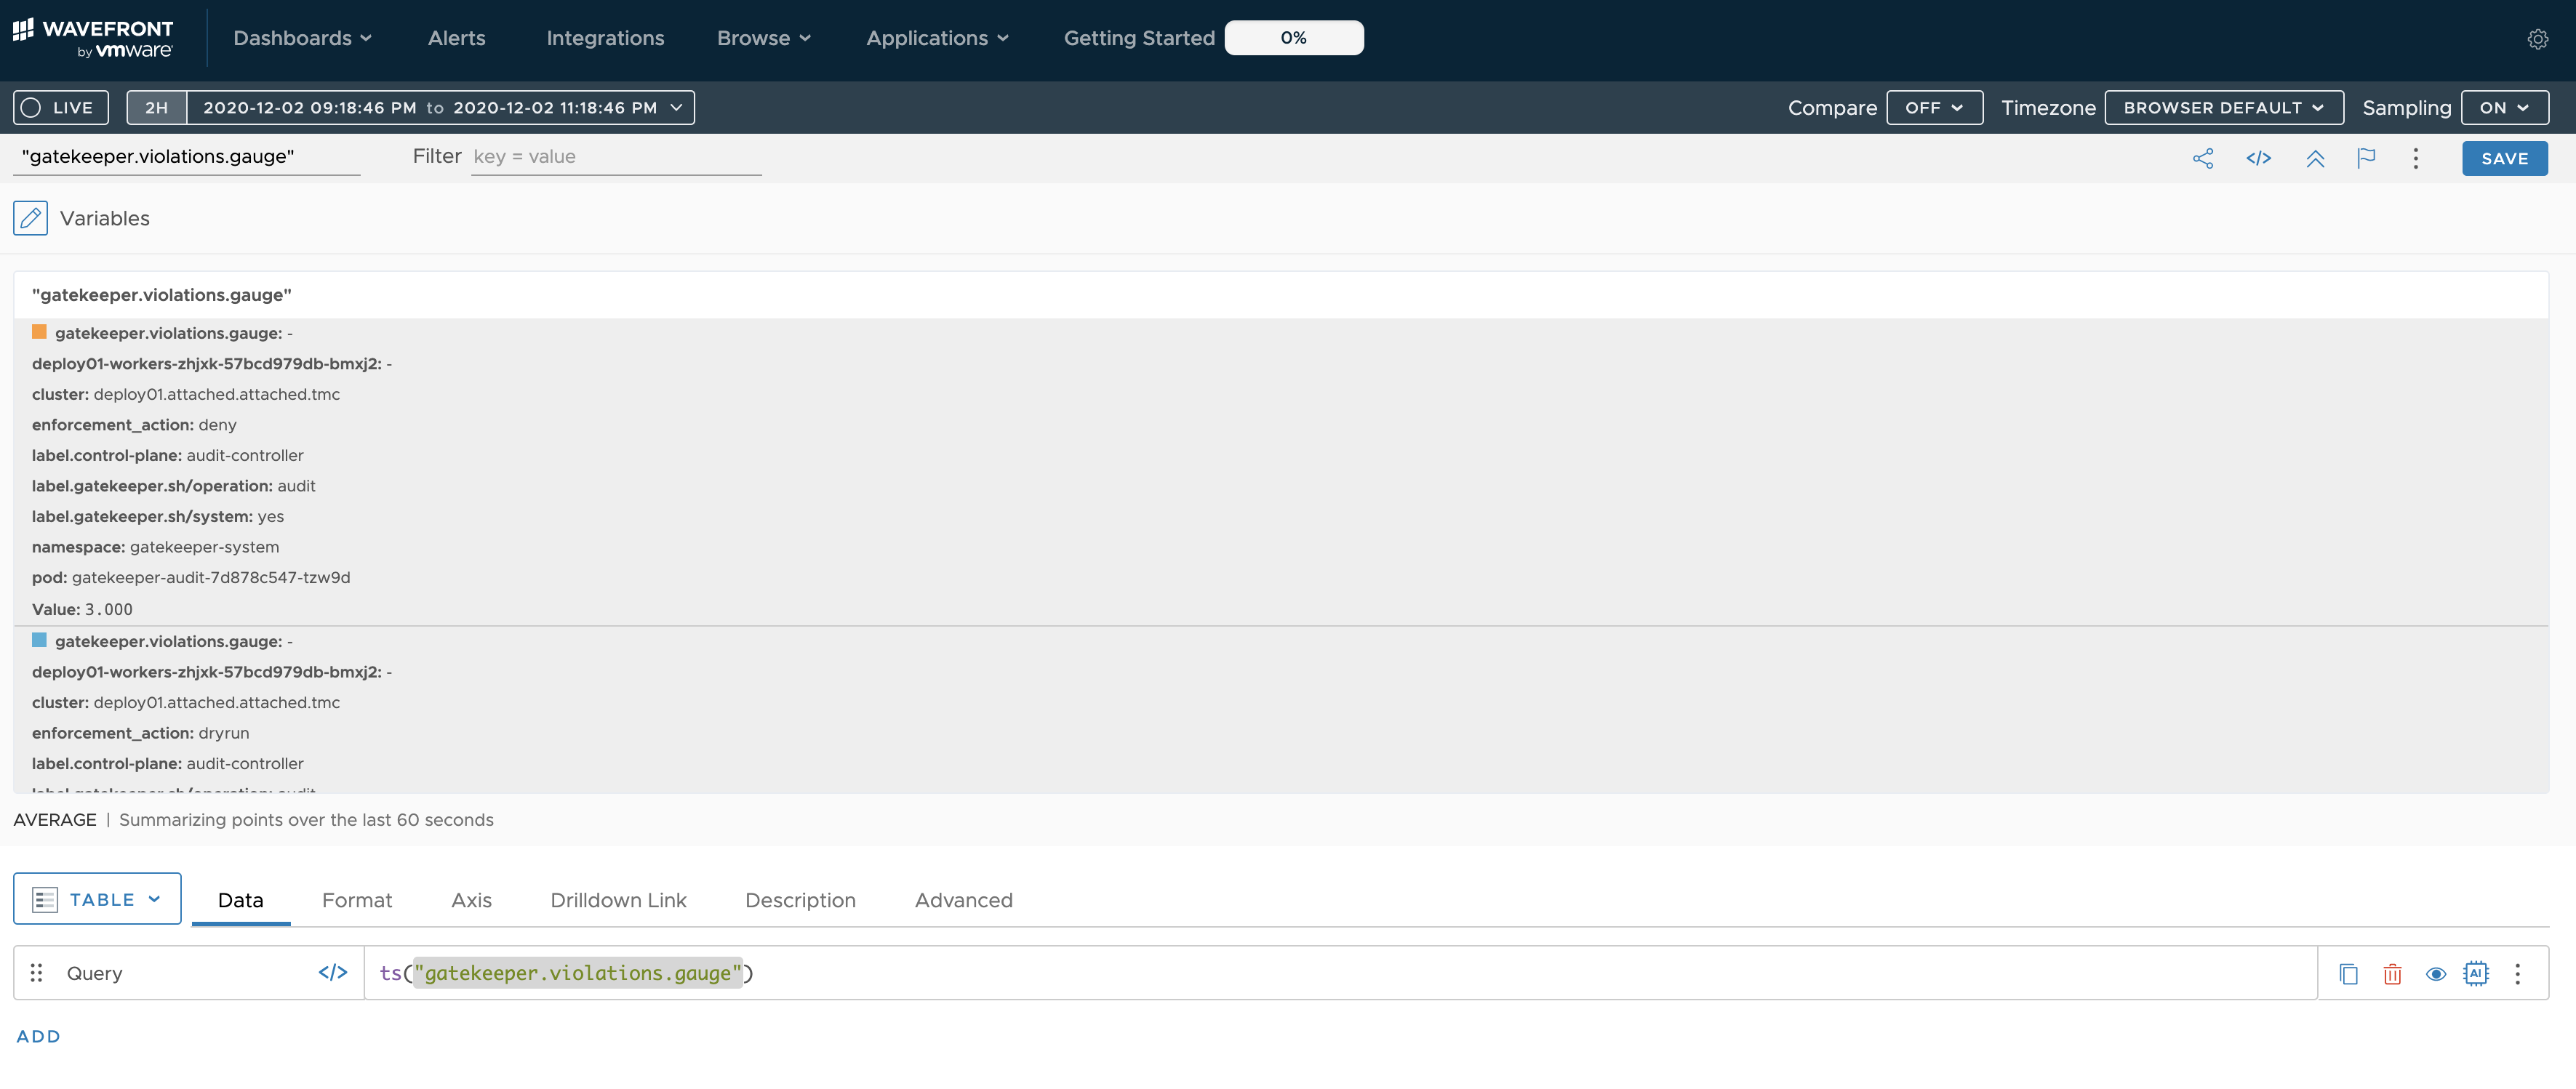
Entries carrying enforcement_action: deny are the policy violations. This value matches (should match) what TMC reports. From here on it's all TO's world — define alerts to get notified about policy violations and so on.
Summary
TMC policy violations are built on OPA, so they can easily be fed into TO.